
 Temperature has preceded CO2 concentrations on Earth for the last 450,000 years, but that somehow slipped under the radar, and now revisiting the Climategate emails the Midieval Warm Period was equal to todays temperatures if not warmer but bogus climate charts are emerging across social media showing otherwise, plus rocket tests in Norway are explained by Jim Lee at Climate Viewer.
Barium Rocket Tests & Crayons on Climate Charts
This video was originally published 29/4/2019
The chart below shows CO2 trailing temperatures which is the norm for the last 450,000 years, but somehow, in the last 40 years the scientific narrative regarding this, magically flipped. Maybe, the IPCC is telling us the wrong thing, because this is an established fact for 450,000 years.

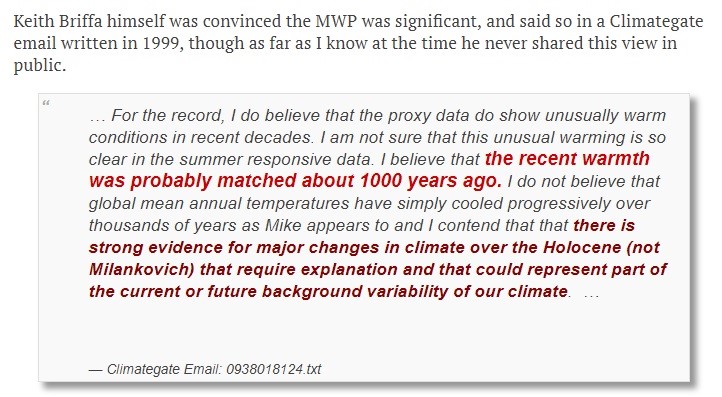
Even if you look back at the emails of Climategate during the Medieval Warming Period (MWP), they are not so sure if the unusual warming is really happening in summer responsive data. In addition, it looks like the Medieval Warming Period a thousand years ago, was very similar to today’s temperatures if not warmer.
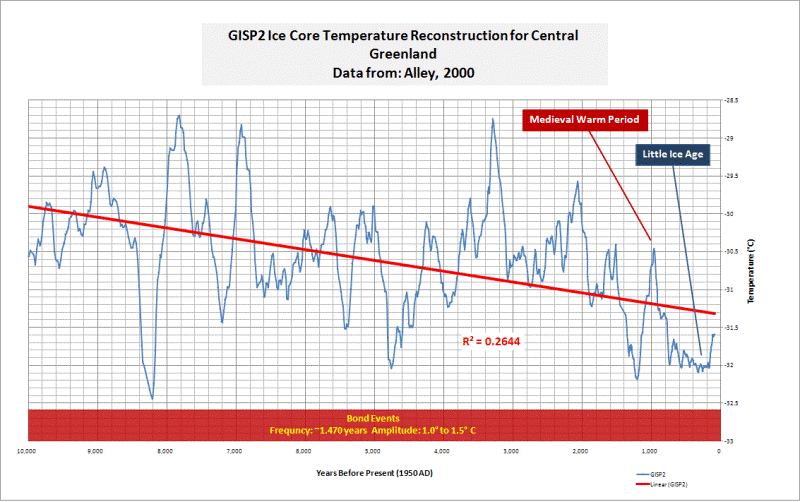
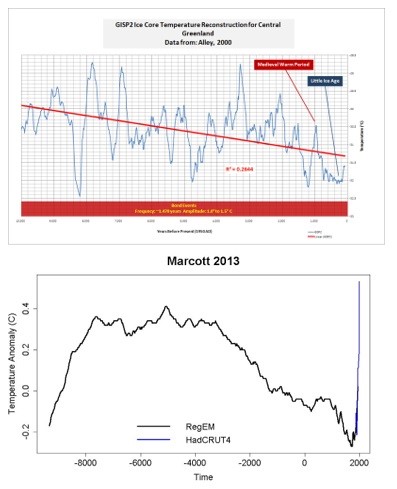
Let’s take a look at the Greenland Ice Core Survey Project, otherwise known as the gold standard for climate and temperature reconstruction on our planet, the GISP2. As can be seen, the peak marked as Medieval Warming Period is warmer than today's temperatures.
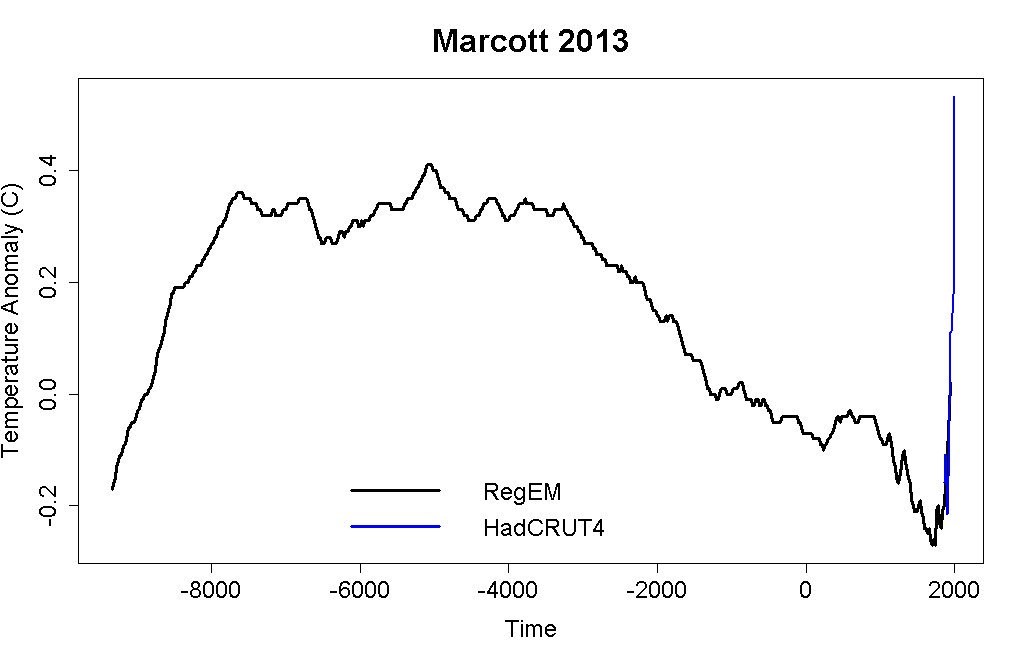
Yet somehow, this debunked Marcott 2013 et al, looks like children scratching crayon on this climate reconstruction, but is still making the rounds. In my opinion, putting this out to social media streams is purposeful deception.
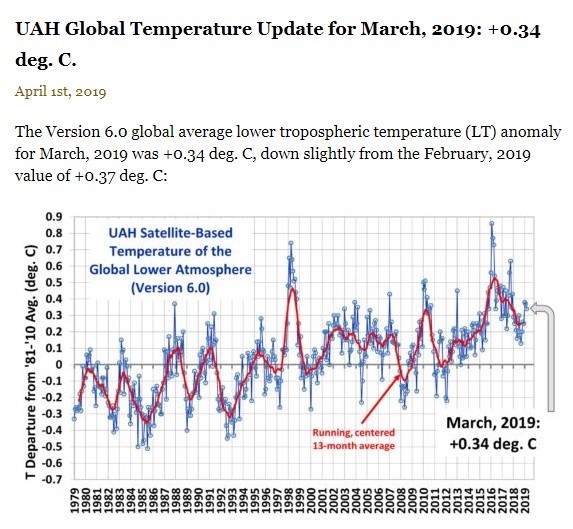
When we look at University of Alabama Huntsville (UAH), March 2019 temperatures they are at 0.34 degrees Celsius above the baseline.
Let’s put these together for better analysis. The top chart is the gold standard GISP2 temperature reconstruction of our Earth for the last 10,000 years, while the marking with blue crayon on the bottom, is from Marcott 2013. There sure are a lot of peaks left out especially when you go left on the chart, back from the present day with where the blue crayon mark is. They missed several heat spikes for the last 2,000 years. Was that on purpose?
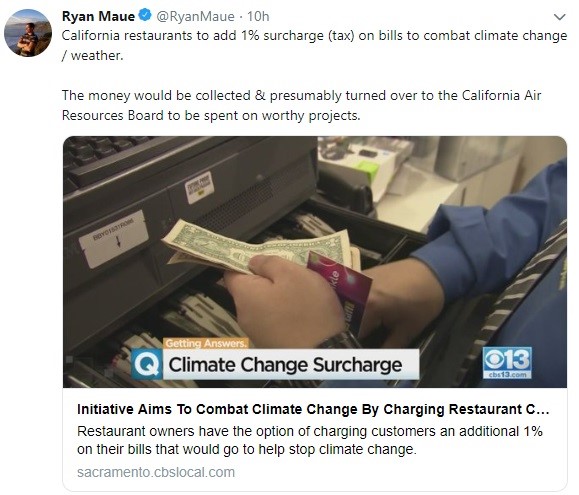
Meanwhile, state governments will help you do ridiculous stuff like this, a 1% surcharge added to restaurant bills in California. Apparently, this will go to California Air Resources Board to be spent on “worthy projects”, with no oversight.
Do you mean all that tax money gets funneled somewhere, but they are not going to be audited because a separate side board is taking care of all the worthy projects?
That is just like the “global tax” they want to institute to fund the IPCC, or the UN fund that will have no culpability because they are not audited. These are exactly the same, but on a very minor scale. I think they might be beta-testing this to see if anybody will ask where the money goes, or if it ever does get collected based on the false premise of Global Warming.
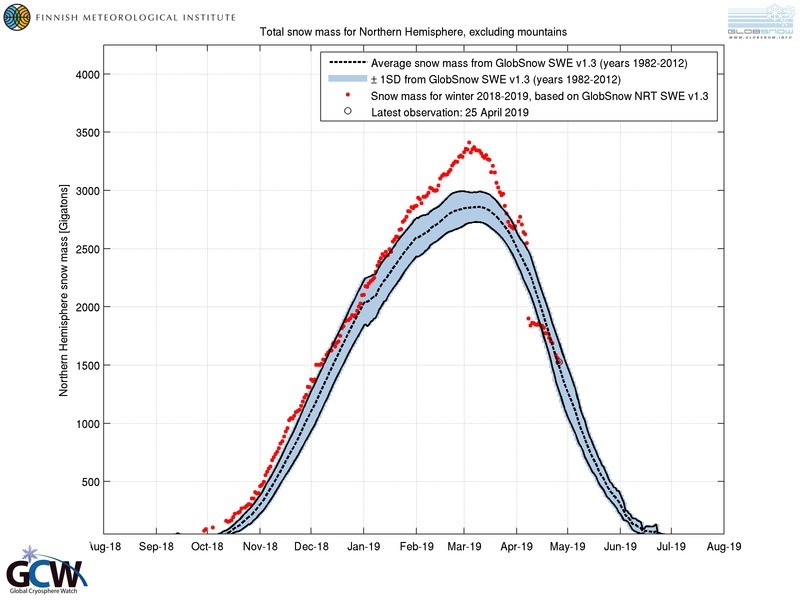
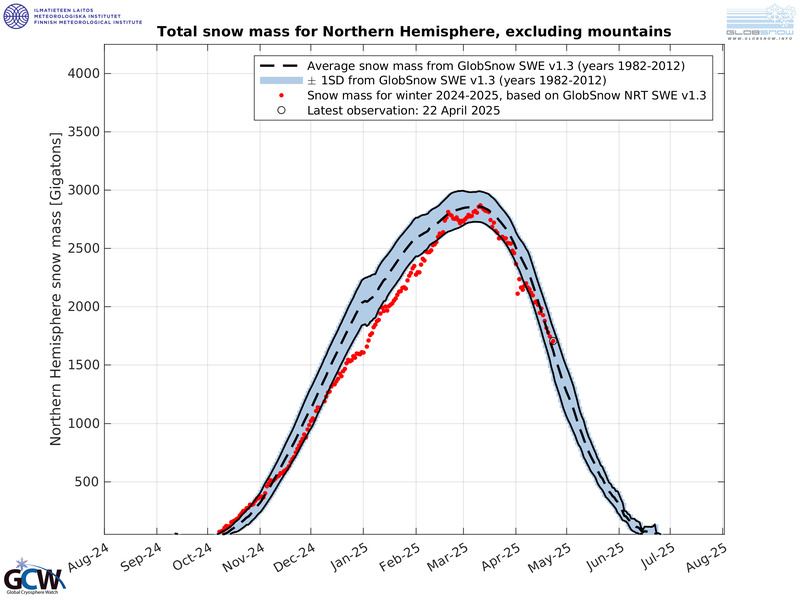
How will you respond when you see record snow accumulation totals across the Northern Hemisphere for the second year in a row, in the same months, breaking all-time records for snowfall? Then somebody tries to tell you that it is caused by warming oceans?
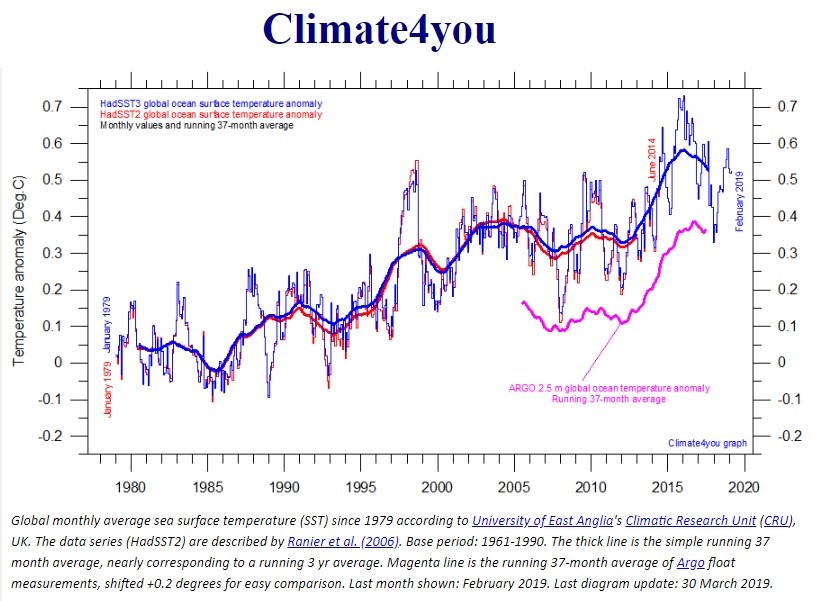
You can show this chart from Climate4you and show that the oceans were nearly as warm in 1998 as they are today, and they have also kept the same trajectory of heat.
We are starting to get this snow right now due to the intensification of the Grand Solar Minimum.
What happened during the hot ocean years of 2000, 2004 to 2010? No record snows, until last year and this year. What flip do you think happened? It is the Sun and the onset of the Grand Solar Minimum?
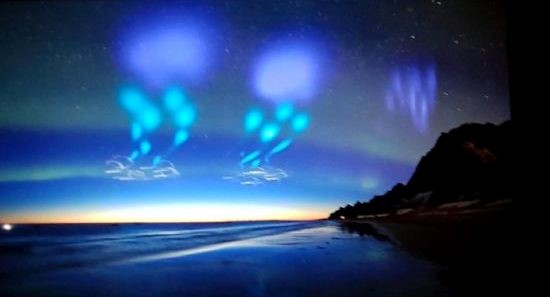
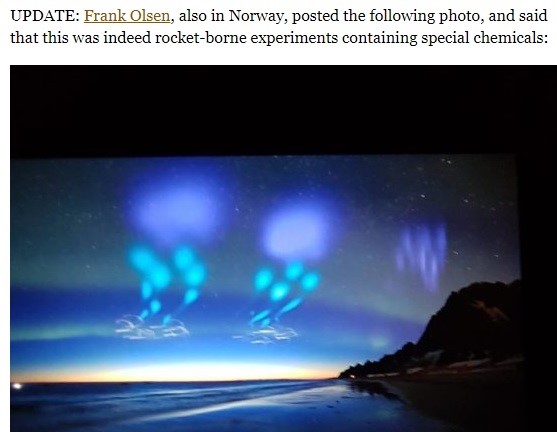
On the other hand, what are these unusual lights in the sky? This is rocket testing with barium and other types of chemicals, known as rocket-borne experiments. This involves special chemicals, and they will never tell you what those are.
But, Jim Lee at Climateviewer.com goes into great detail about ionospheric heaters, geophysical warfare and what all those little colored dots in the sky mean. This too, is a must-watch video. Also, if you are interested, I included the link of my two-hour interview with Jim last year, at the end of this article about Geoengineering to take credit for a cooling planet in a cycle that will naturally cool the Earth. IPCC can take credit for the cooling and ask for more tax money because it worked and must be “on going”
It is expected that during these uncertain times, climate data manipulation through government agencies will be rampant, to try to mask the cooling on our planet. How prepared are you for food scarcity and food price rises? Are you protecting your own food supply?
Thanks for reading, I hope you got something out of the article. If you like more information like this, I produce the tri-weekly Mini Ice Age Conversations podcast, 30 minutes of in-depth analysis on the GSM you can take on the go.
PDF of this Article Greenland Glaciers Start to Recover as Solar Activity Declines
FULL VIDEO Greenland Glaciers Start to Recover as Solar Activity Declines
"Help support the adapt 2030 channel on brighteon so we can keep grand solar minimum information free to access."
Volcanism in the Mini Ice Age, Which Eruption will Drop Earth's Temperate Next (385)
https://www.brighteon.com/6010048504001
***Mini Ice Age Conversations Podcast***
iTunes: https://itunes.apple.com/us/podcast/adapt2030
Soundcloud: https://soundcloud.com/adapt-2030
Libsyn: http://adapt2030.libsyn.com/
***Support ADAPT 2030 by Visiting Our Sponsors***
ADAPT 2030 & My Patriot Supply
Taking the Fear Out of Difficult Situations
2-Week Food Supply with 92 servings
True Leaf Market Organic & Heirloom Seeds
ADAPT 2030 True Leaf Market Link
ADAPT 2030 Amazon Grand Solar Minimum Book Store
https://www.amazon.com/shop/adapt2030
*** Today’s Story Links ***
Snow totals Northern Hemisphere https://globalcryospherewatch.org/state_of_cryo/snow/fmi_swe_tracker.jpg
Weather Modification & Cosmic Ray Cloud Formation: Jim Lee of ClimateViewer / ADAPT 2030 https://www.youtube.com/watch?v=o6bcSoD0Y8I
Children playing with crayons in climate reconstructions https://pbs.twimg.com/media/D413kErUEAYwwbb.jpg
Climateviewer.com Strange lights over Norway http://www.drroyspencer.com/2019/04/strange-lights-over-norway/
Ionospheric Heaters — Space Weather Control and Geophysical Warfare https://climateviewer.com/2018/11/14/ionospheric-heaters-space-weather-control-geophysical-warfare/
*** ADAPT 2030 Social Media Links ***
PATREON www.patreon.com/adapt2030
YOUTUBE ADAPT 2030 Mini Ice Age 2015–2035 Series on YouTube
BITCHUTE https://www.bitchute.com/hashtag/adapt2030/
BRIGHTEON https://www.brighteon.com/channel/adapt2030
STEEM https://steemit.com/@adapt2030
MINDS https://www.minds.com/ADAPT2030
MEDIUM https://medium.com/@globalcooling
FB https://www.facebook.com/Miniiceage
TWITTER https://twitter.com/adapt2030