
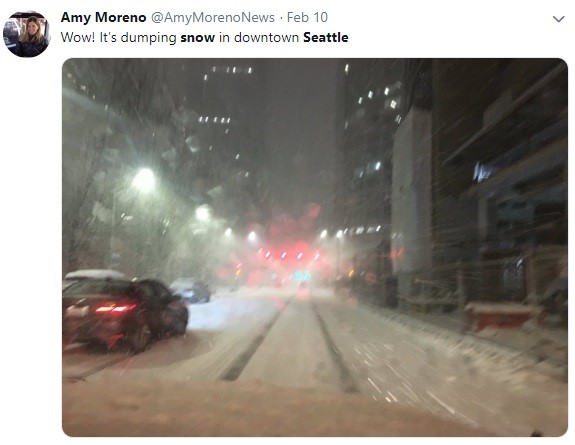
 The corporate controlled media is really good at showing you these type of images, where it seemed to be like it’s only a 10th inch of a snow when they talk about the snowiest so far in 20 years, 30 years, 50 years or 70 years. They show these really tiny snow totals in the images, so you would think, it’s not very much snow and it never snowed in that place anyway.
Jet Streams Are In The Wrong Place
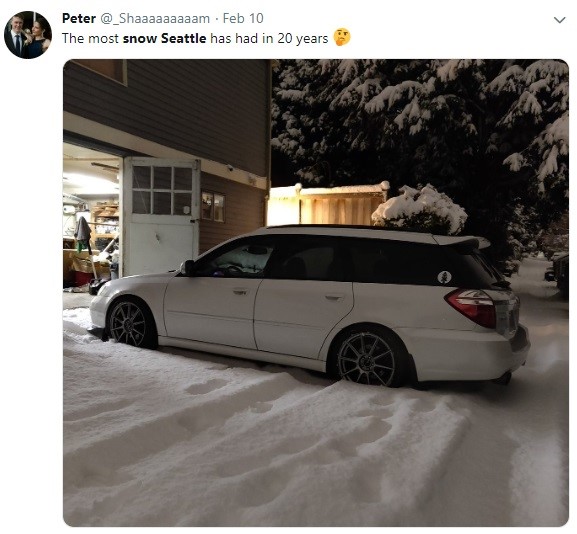
Originally though, on February 10, this was the most snow in 20 years, so people aren't used to that. They grew up with a very moderate and a very temperate climate and it rarely snows there too.
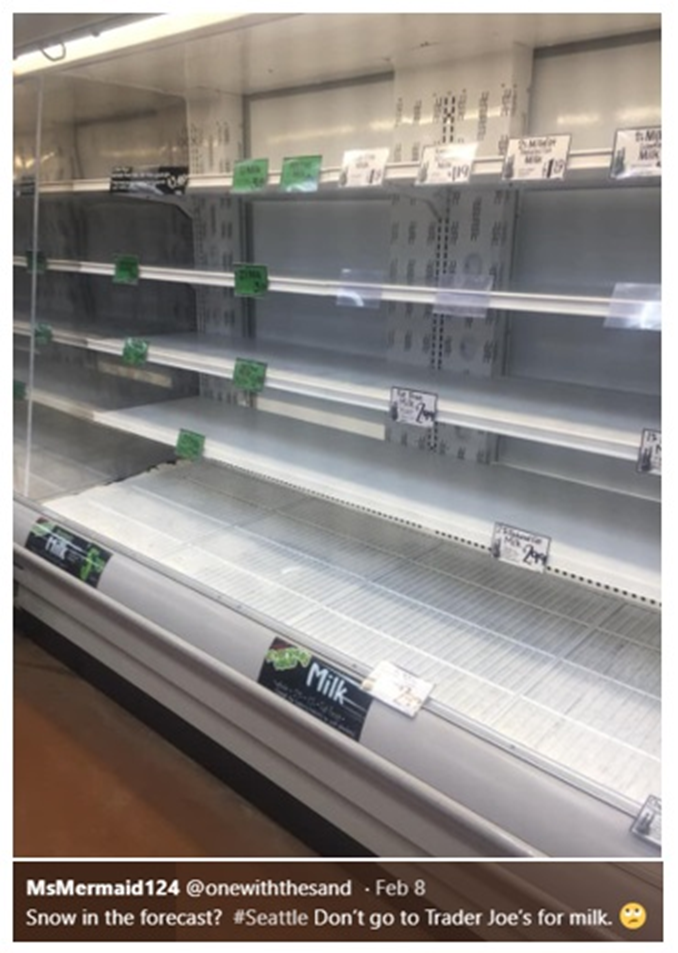
So when this happened, people panicked. They went to the stores and bought everything off the shelves. This is a recurring theme showing images of an empty shelf, an empty shelf and yet another empty shelf. This “empty shelf” scenario might not happen somewhere in Chicago, in Buffalo and in Minnesota because they’re used to these types of storms, but not in Seattle.
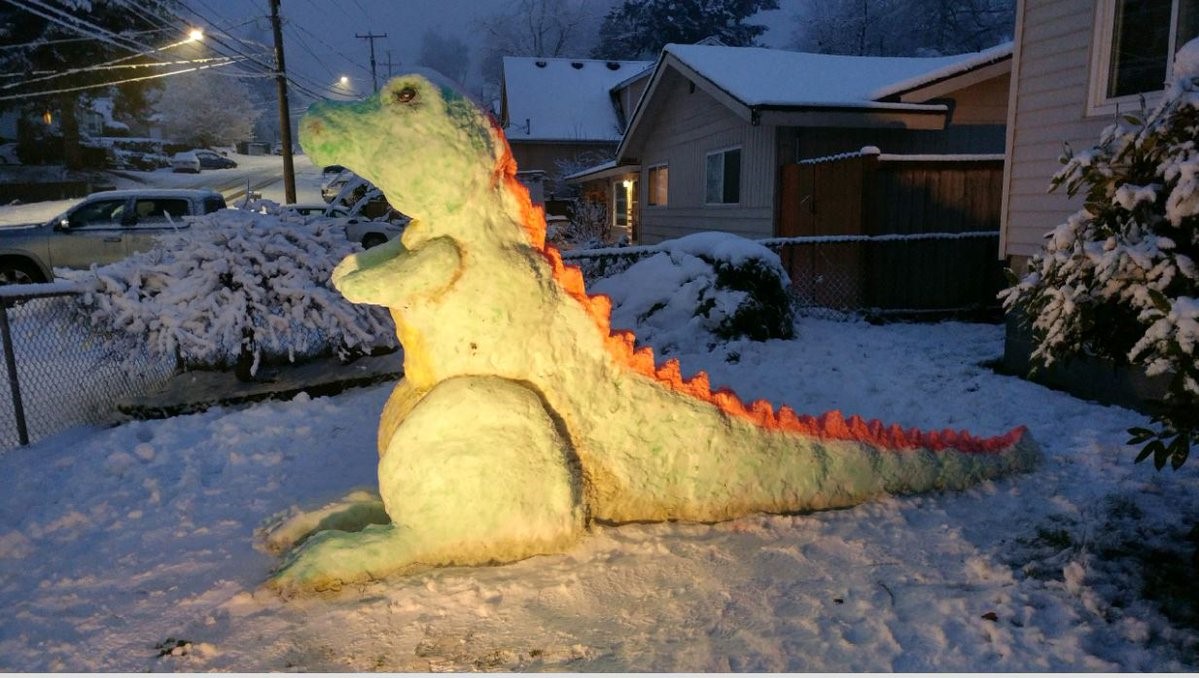
But while you're stuck at home, get some food coloring, take the kids outside and make a dino. I really like the creativity of the snow art that's come up in this event, from the feet, to the dinosaur.
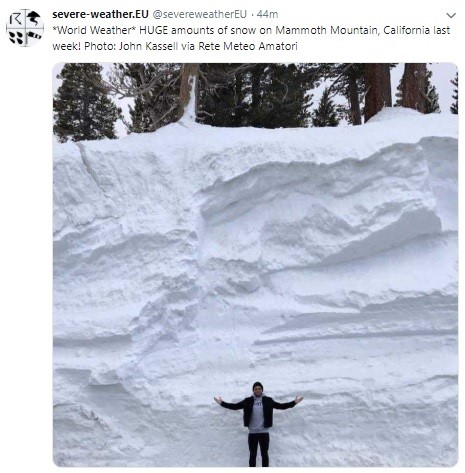
Speaking of snow, let's take a look at Mammoth Mountain, California. This massive snowpack is actually tied so far with the 2016-2017 all-time record snowpack in the Sierra Nevada’s. But, in two months they're going to break that record and probably put another 20% on top, making it the all-time most amount of snow to ever fall in the Sierra Nevada mountains.
Similarly, the National Oceanic Atmospheric Administration (NOAA) put out the 6 – 10 Day Outlook cold forecast, revealing a hundred percent probability of below. This is shown in the dark purple shade in the Temperature Probability Map.
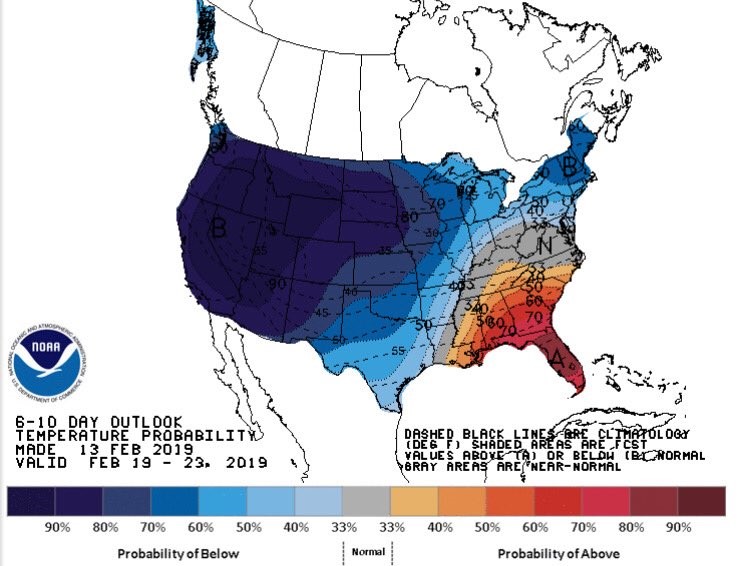
Hence, it’s guaranteed that this year is going to be cooler than average. I’m just wondering if any temperature records were broken in these cold events that occurred during the first two weeks of February.
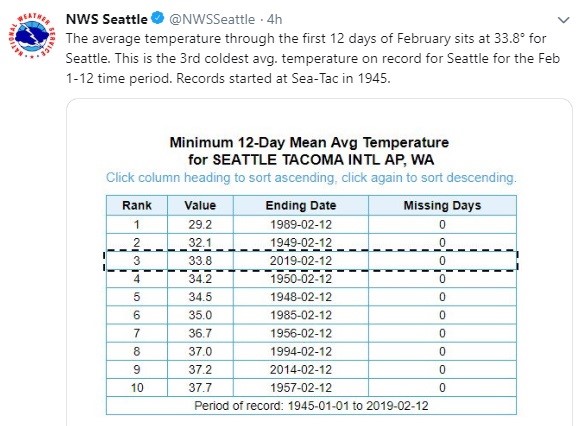
As seen in this particular data set, the first two weeks of February, 2019 is the 3rd coldest, since 1945. The Global Warming models however, would have it warmer and warmer. So now, I’m confused. How is it possible that we are keeping this trajectory of going cooler, of more record snow, of more record wind and more record cold?
These events were observed continentally, city wise and regionally, but these were still supposed to be blamed on CO2, while in actuality, it’s the opposite to what the forecasts show.
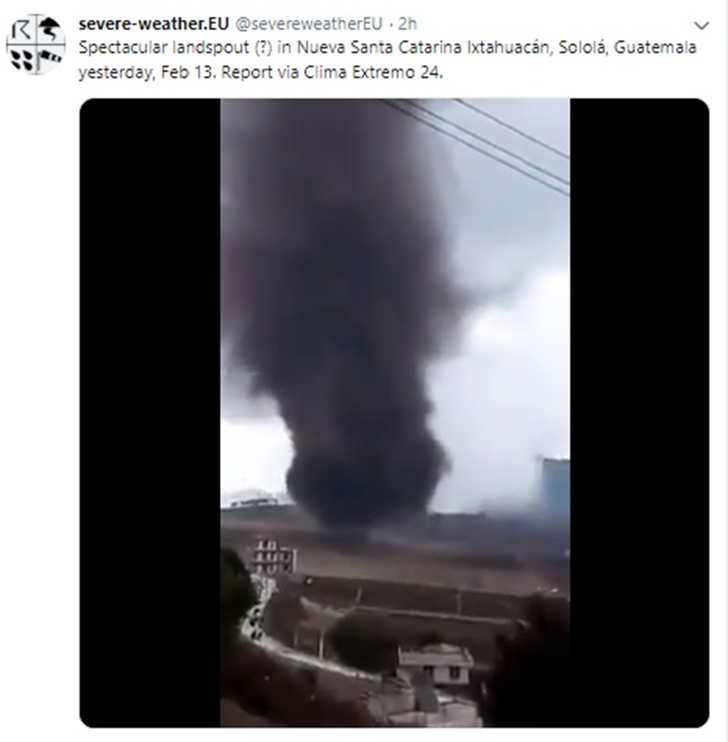
My personal analysis regarding this is: Our jet streams are in the wrong place, brought about by the Sun’s natural cycle. The tornado event that took place in Guatemala is another of the many significant indicators of this. They're calling this a land spout, and it sort of looks like a dust devil at some point, but it sure looks like it could be an EF-1 tornado ripping through the area.
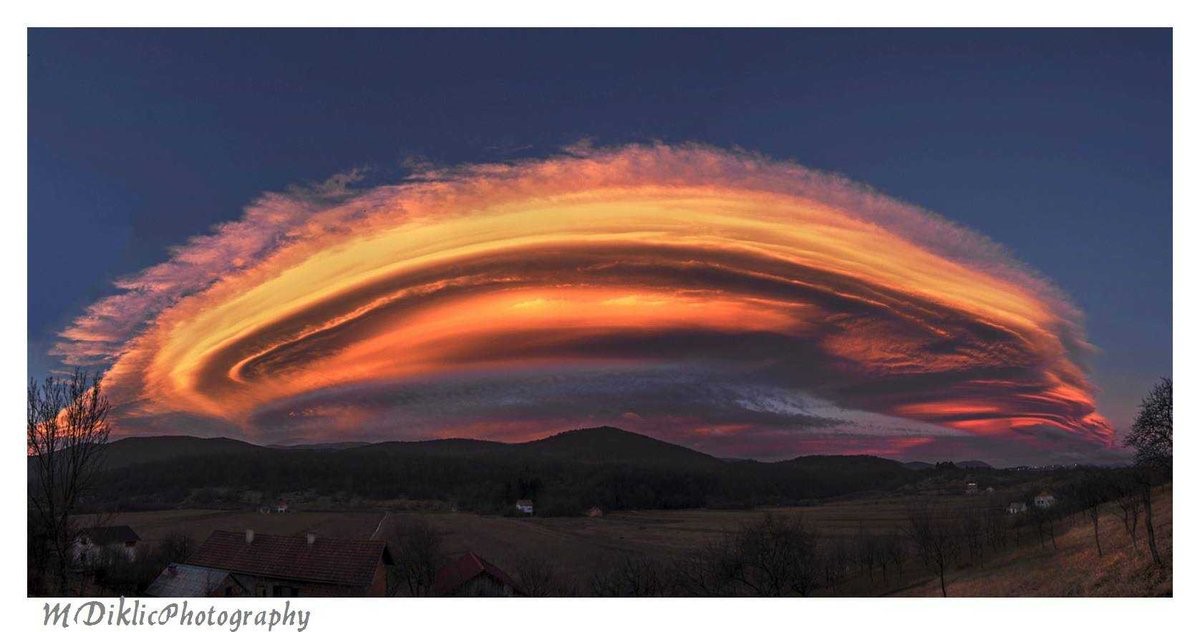
Then down in Croatia, Adriatic gets also an amazing blasts of weather this year.
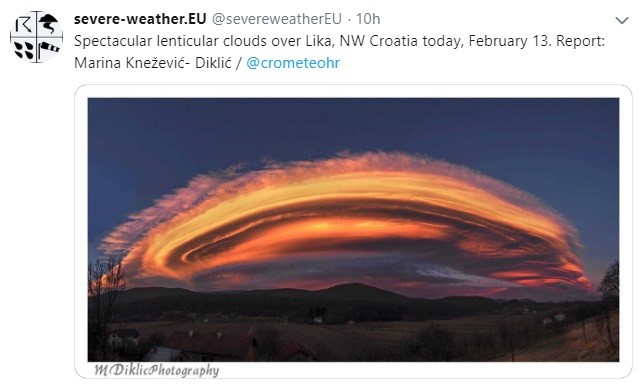
These are stunning shots of lenticular clouds taken in Croatia. Hvala vam, Diklic! Thanks for taking the shot.
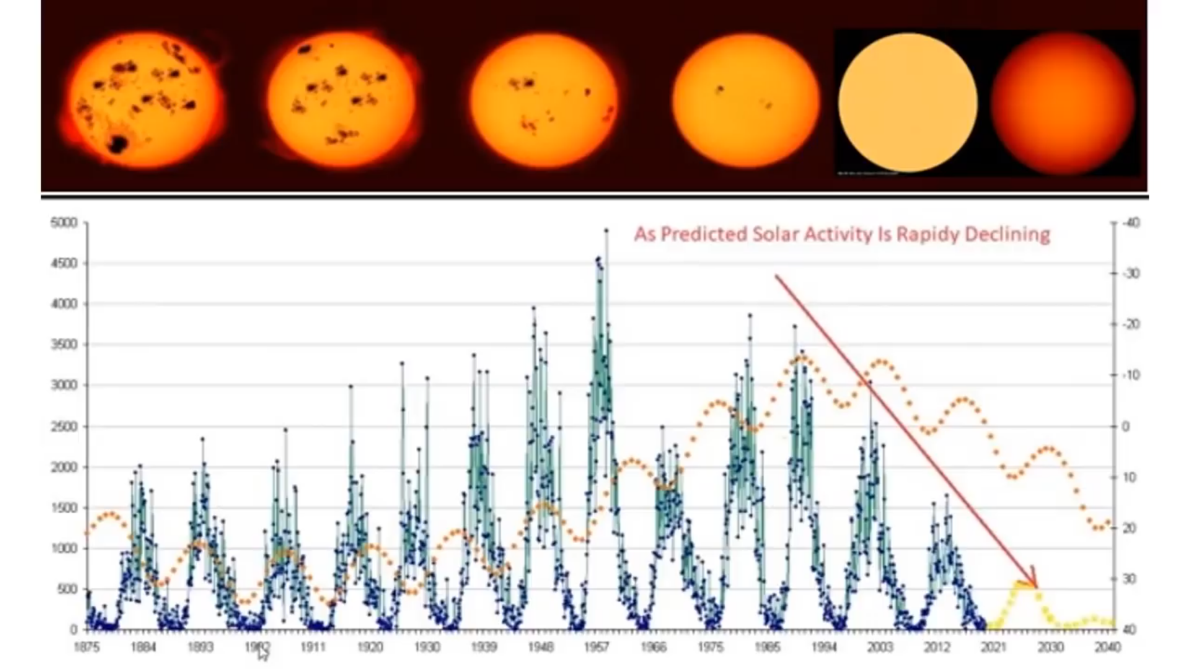
Curiously though, the global corporate media never talks about our Sun repeating a 400-year pattern of low solar activity.
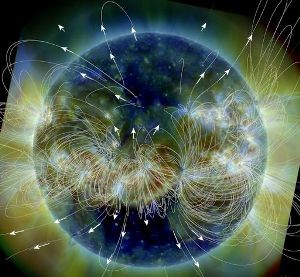
This low solar activity of the sun is going to have changes in both our cloud cells and our jet streams. They're going to be in the wrong places, and we're going to start to see shifting around of moisture patterns, droughts, as well as temperature anomalies, where cold temperatures in one place or hot temperature is being pushed up in a wrong place.
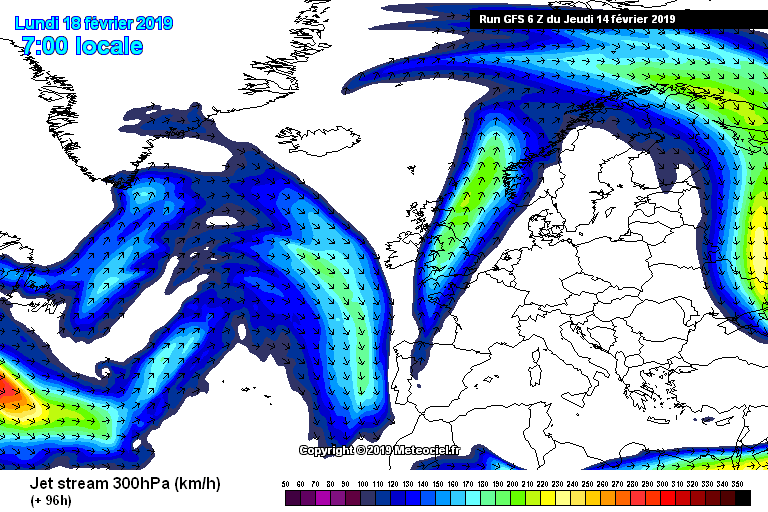
This brings us to the 18th of February, where we’ll start to see how the jet streams are bending around in Europe.
Comparably, bringing you back to the US in the same time frame next week, two jets will be slamming and will be breaking into each other. A polar jet slams with a subtropical jet as seen via satellite. That area circled in the chart, is an extreme weather event.

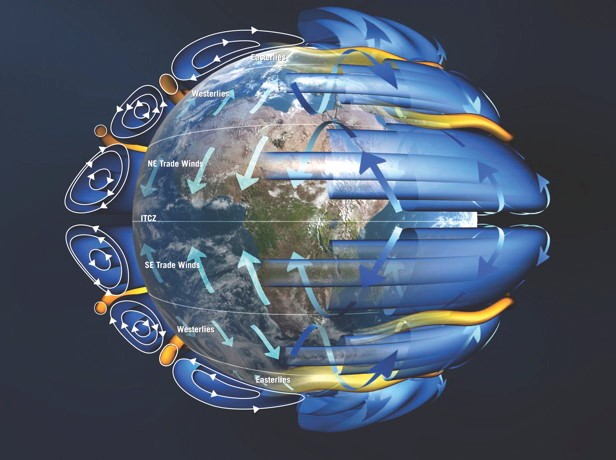
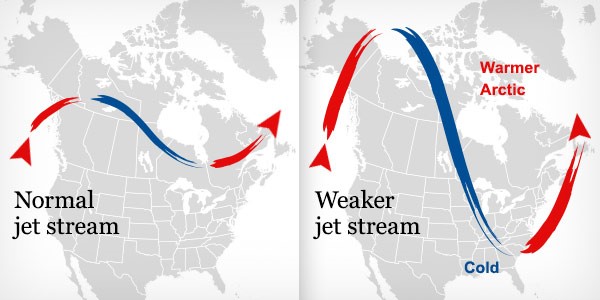
While we are in the middle of all these weather anomalies, I keep hearing about this repeating narrative trying to explain away all these. One of which is: “Record cold is due to the warmer Arctic creating record cold because it is a warmer Arctic.” They even try to show these really cute graphics here with nice coloration. I must admit the gray with the blue and the red gave it a nice touch. Normal jet streams on the left, and bad-polluting-CO2-inducing-climate-change people are on the right.
Nevertheless, they never really talk about these natural undulations. It is a fact that we go from El Nino to La Nina, back and forth for several times through generations as long as we're alive on this planet. These cause changes in precipitation, wind velocity, and all these other things in between. These natural undulations are also how people forecast futures market for Ag Products, and these people can attest that these changes are natural.
Yet, nobody wants to talk about natural variability in the Sun on its 400-year cycle, or even just the other significant changes that roll around every 5 to 7 years. It’s got to be CO2, because you can't tax the Sun.
Thanks for reading, I hope you got something out of the article. If you like more information like this, I produce the tri-weekly Mini Ice Age Conversations podcast, 30 minutes of an in depth analysis on the GSM you can take on the go.
PDF of this Article West Coast USA Snow Records Verify Jet Stream Shift
FULL VIDEO West Coast USA Snow Records Verify Jet Stream Shift
"Help support the adapt 2030 channel on brighteon so we can keep grand solar minimum information free to access."
Volcanism in the Mini Ice Age, Which Eruption will Drop Earth's Temperate Next (385)
https://www.brighteon.com/6010048504001
***Mini Ice Age Conversations Podcast***
iTunes: https://itunes.apple.com/us/podcast/adapt2030
Soundcloud: https://soundcloud.com/adapt-2030
Libsyn: http://adapt2030.libsyn.com/
***Support ADAPT 2030 by Visiting Our Sponsors***
ADAPT 2030 & My Patriot Supply
Taking the Fear Out of Difficult Situations
2-Week Food Supply with 92 servings
True Leaf Market Organic & Heirloom Seeds
ADAPT 2030 True Leaf Market Link
ADAPT 2030 Amazon Grand Solar Minimum Book Store
https://www.amazon.com/shop/adapt2030
*** Today’s Story Links ***
Lenticular cloud Croatia
https://pbs.twimg.com/media/DzUu4ILUYAATDy8.jpg
Snowiest Seattle by month
https://pbs.twimg.com/media/DzLKQ5sXQAAXh_C.jpg https://pbs.twimg.com/media/DzTaW9oX4AAGtIl.jpg
NWS 10 day forecast
https://pbs.twimg.com/media/DzVwN4EU8AEDOL6.jpg https://pbs.twimg.com/media/DzUN76SWsAsgsHR.jpg https://pbs.twimg.com/media/DzT5zZNXcAA0OD5.jpg
Two feet https://pbs.twimg.com/media/Dy6LDdiX4AEZgEH.jpg
Dinosaur Snow Sculpture
https://pbs.twimg.com/media/Dy7gIMyVsAAgrRT.jpg
Snow Seattle https://pbs.twimg.com/media/DzK3t7pXcAUyXdX.jpg https://pbs.twimg.com/media/DzESCLrVYAEOW50.jpg
Seattle snowiest in 70 Years https://www.usatoday.com/story/news/nation/2019/02/10/seattle-snowiest-february-70-years-more-coming/2830164002/
*** ADAPT 2030 Social Media Links ***
PATREON www.patreon.com/adapt2030
YOUTUBE ADAPT 2030 Mini Ice Age 2015–2035 Series on YouTube
BITCHUTE https://www.bitchute.com/hashtag/adapt2030/
BRIGHTEON https://www.brighteon.com/channel/adapt2030
STEEM https://steemit.com/@adapt2030
MINDS https://www.minds.com/ADAPT2030
MEDIUM https://medium.com/@globalcooling
FB https://www.facebook.com/Miniiceage
TWITTER https://twitter.com/adapt2030