
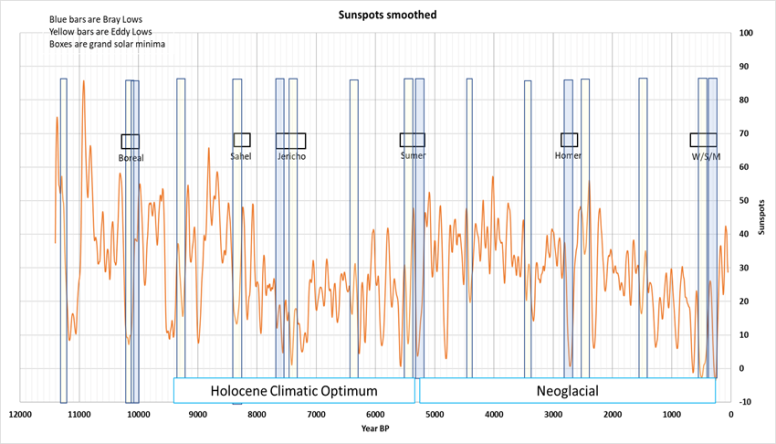
 This is also one of the things the article did not consider, going back in time and talking about longer duration timeframes. They're always focused on the satellite record, the 50-year or a 100-year time frame. What about the last 1,200 years? Why don’t we also look at the intensity of changes that our planet has endured naturally, long before CO2, long before factories, long before cars. The undulations in heat spikes and cold down trends are natural, and we're naturally heading into another down trend at the moment.
Heading Into Another Down Trend At The Moment
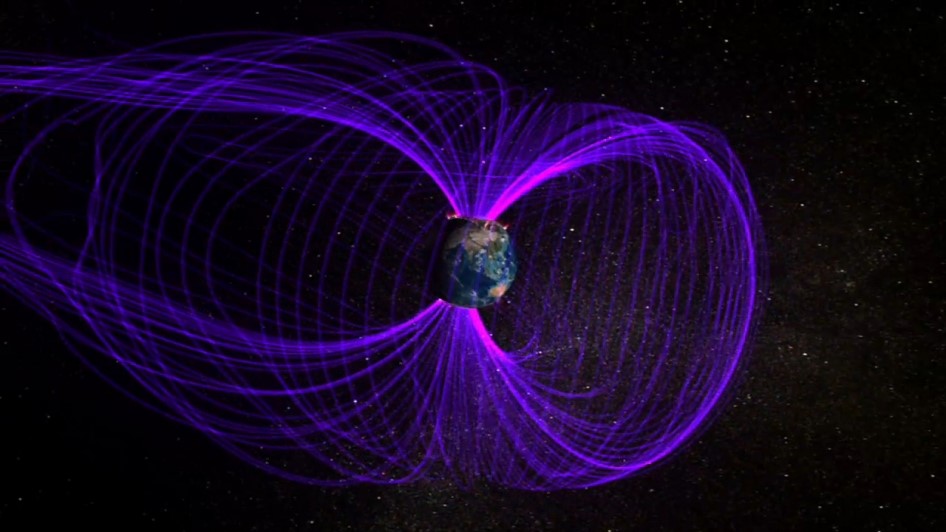
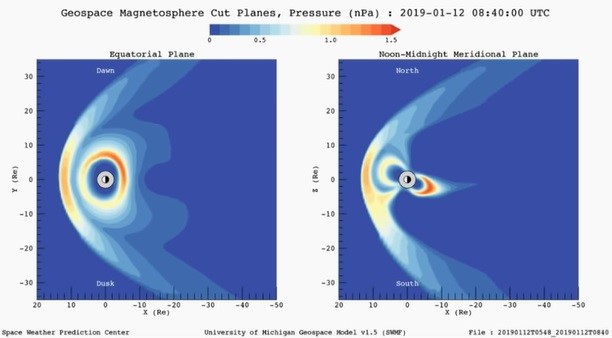
It's all about the magnetosphere, the electromagnetic coupling between Earth’s magnetic poles and the Sun.

Yet, they very boldly stated that human-caused Global Warming has altered the strength in the path of the powerful winds, otherwise known as the Jetstream. They’ve finally come out cleanly saying that the Jetstream has weakened, but as to the causation, this is what I want to discuss.
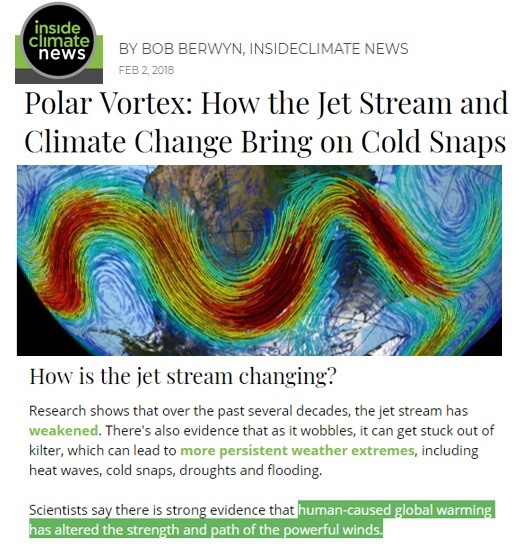
Solar wind is a huge component in the dynamics of what's happening on our planet, and this was not discussed at all, in this article.
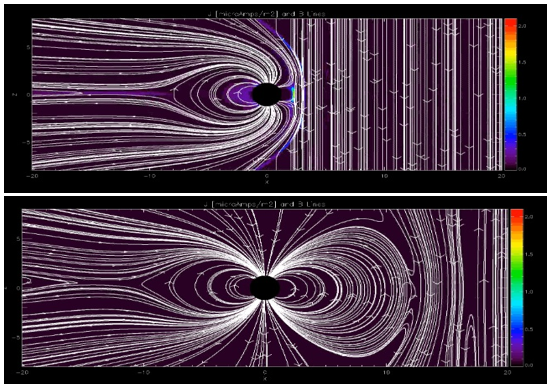
To get you with a better representation, this is a strong solar wind.
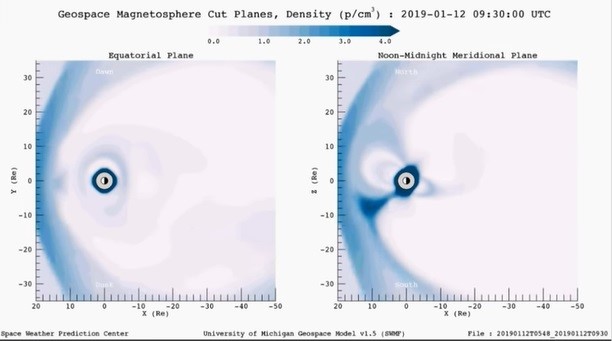
This on one hand, is when there’s no solar wind. And this is happening right now.
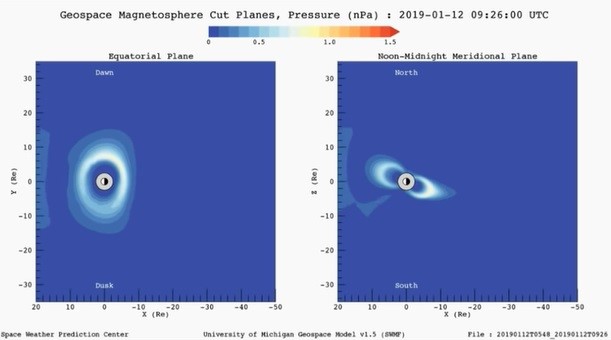
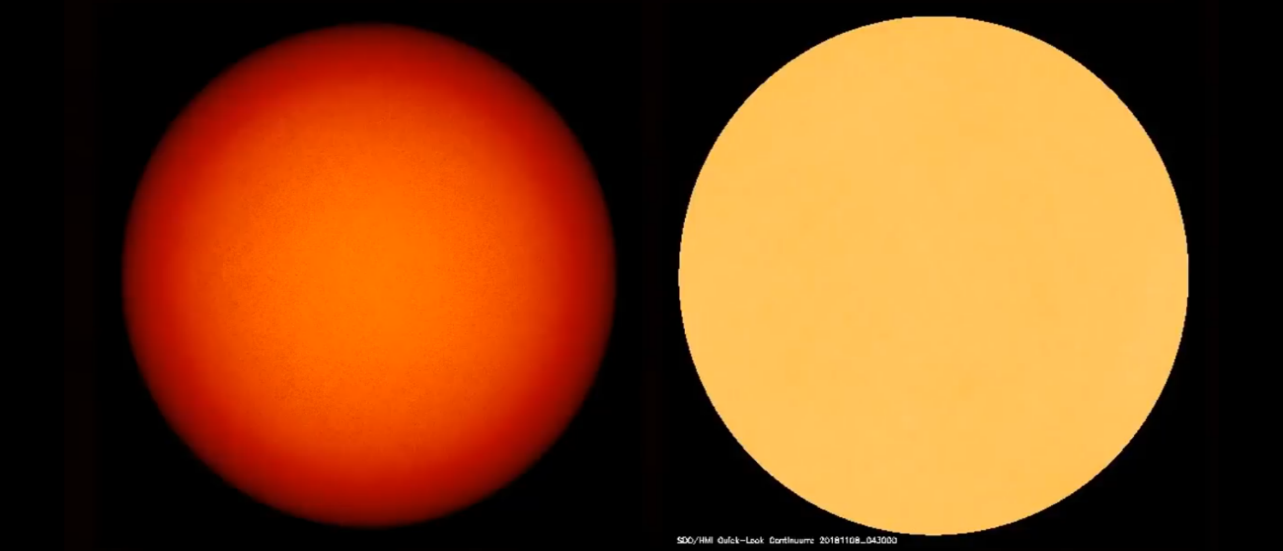
This verifies that the changes in our atmosphere are related to what's happening in our Sun.
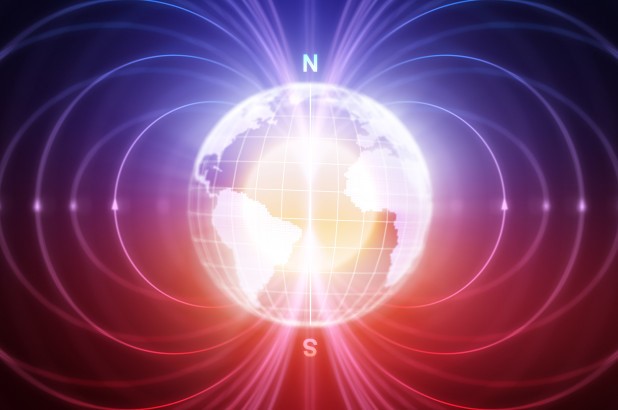
Magnetic field lines form the Earth’s poles, otherwise known as field-aligned currents, lock our magnetosphere tightly, which in turn lock the jet streams in place, so that jet streams would have nice and steady flows.
So what if the media comes clean and accepts that the Sun is the driver of these changes, and that as the Sun decreases its activity state, our weather is going to get more extreme?
Nevertheless, know that the magnetic field lines would weaken and go out wider in their locking toroid flow, if you had less incoming energy. So, to put it in perspective, this declining solar activity over 400-year cycles or 2,000-year cycles or 3,600-year cycles affect Earth’s magnetic field which locks jet streams in place.
Then when solar winds get weaker, we go from compression, to expansion.
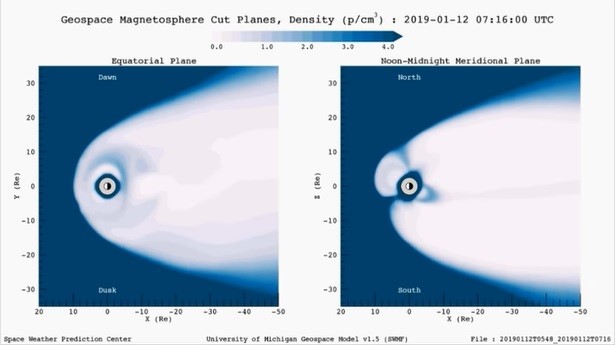
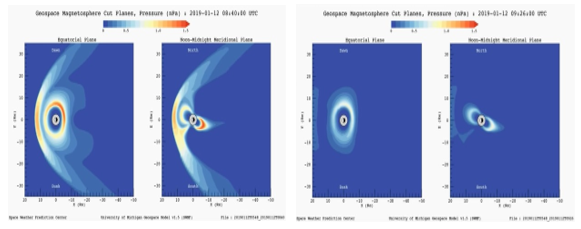
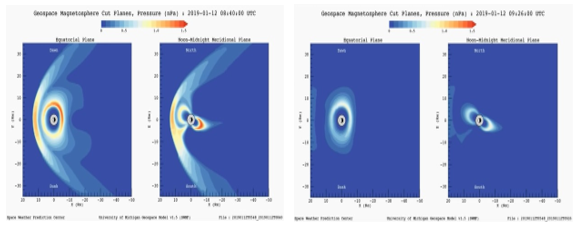
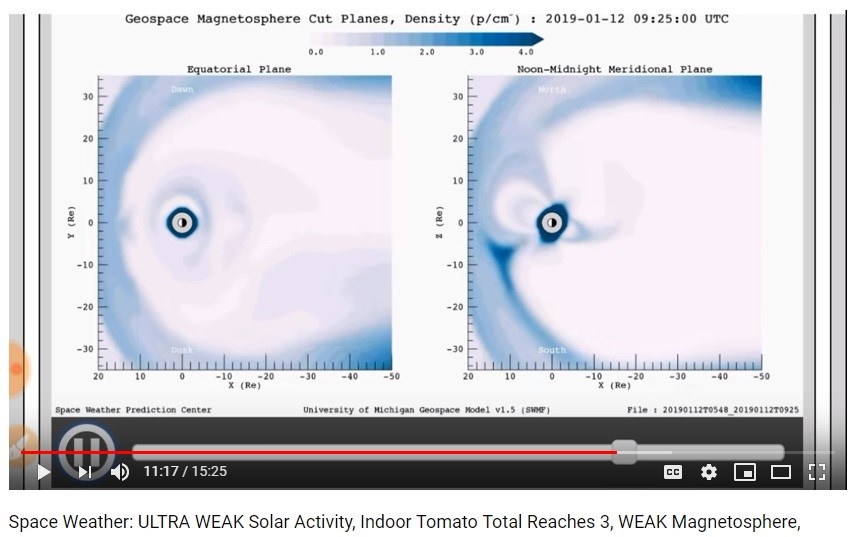
We even have good representations at smAsho mAsh, which puts these illustrations of with solar wind, and no solar wind daily.
These abnormal images of solar winds are not just representations, they are happening right now. You can check this out on Space Weather: ULTRA WEAK Solar Activity, Indoor Tomato Total Reaches 3, WEAK Magnetosphere, and see how these are all coupling.
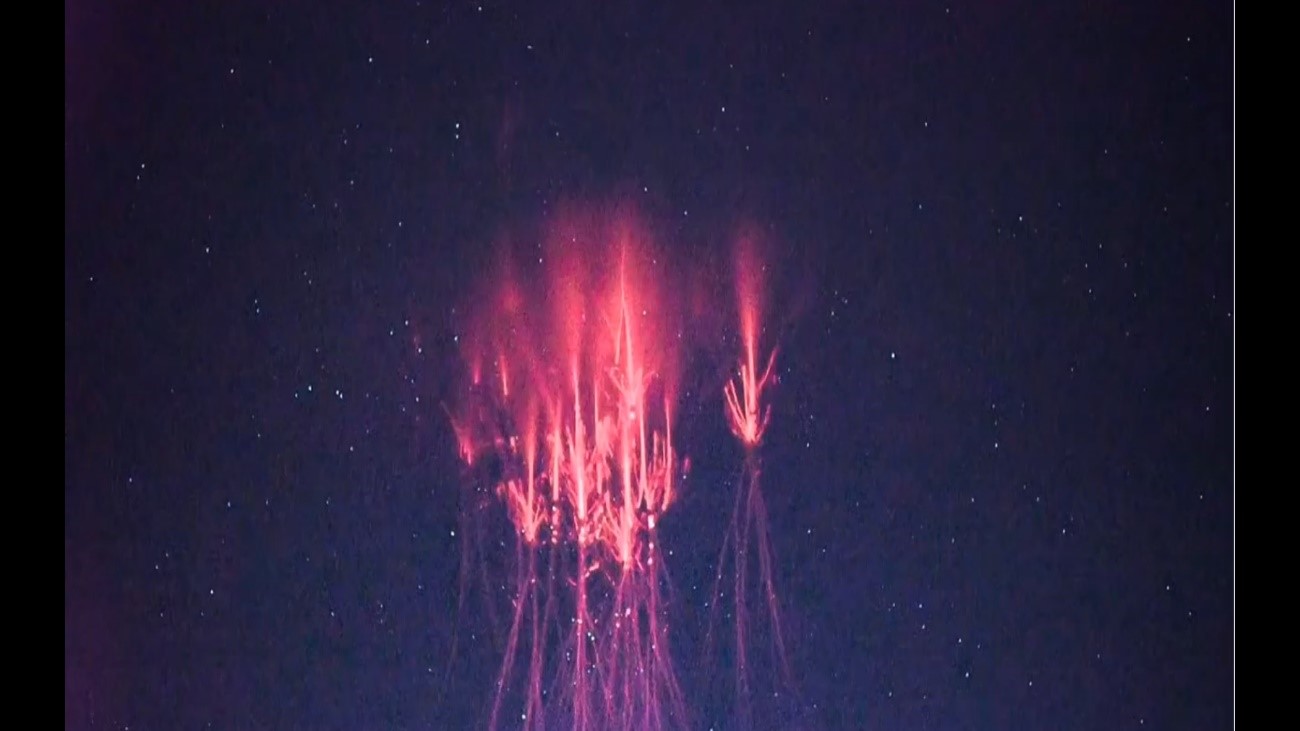
Furthermore, if there were electromagnetic changes, we should start to see more unusual atmospheric lightning events as well, like all the sprites that are being spotted around the planet. It is not coincidental, these effects are all coupled together.
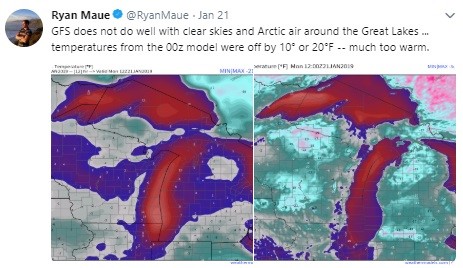
The historical cold that swept all the way to the East Coast, including the Great Lakes, is also evidence of coupling events.
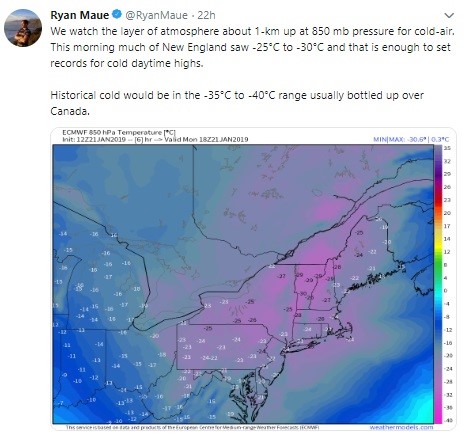
They however said, that during this event, the temperature stations were registering 20 degrees Fahrenheit – much too warm.
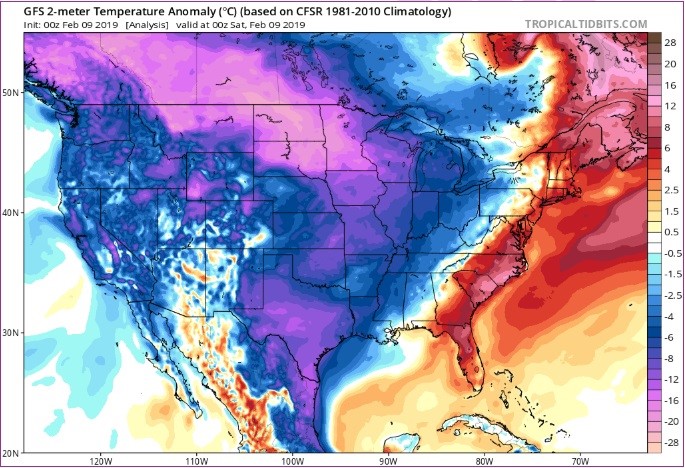
Weather fronts from February 9th to 16th.
More plunging cold temperatures are all the way down to southern Mexico this time. Even Texas, in the middle of the month.
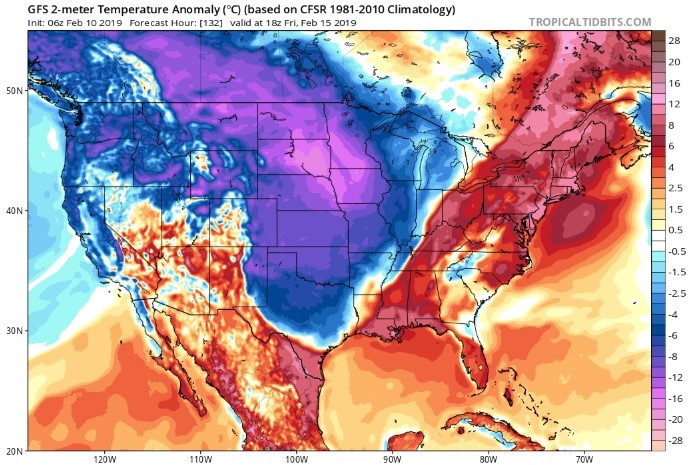
On the 16th, cold also going to sweep through Florida. The leading edge of the Jetstream can actually be seen, where it's bent in the wrong direction.
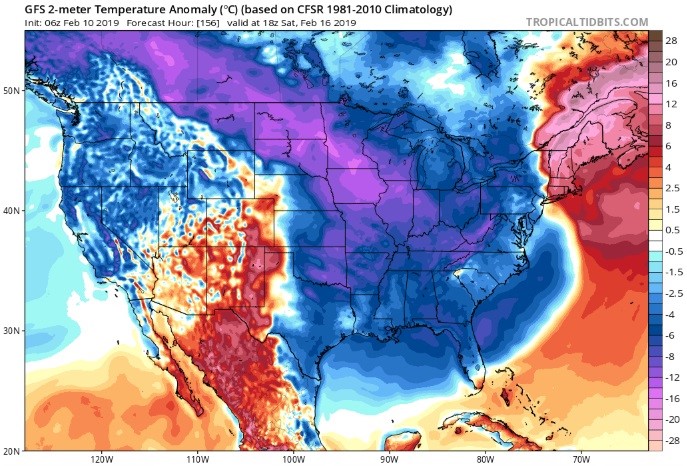
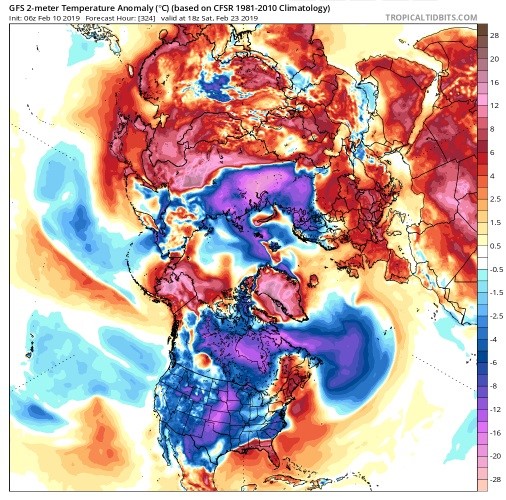
The orientation is off on where the Jetstream should be, this is not CO2, it is the Sun. Here's another glimpse if you’re not yet convinced. As shown, the Jetstream should be more of a north-south orientation, instead of east-west orientation.
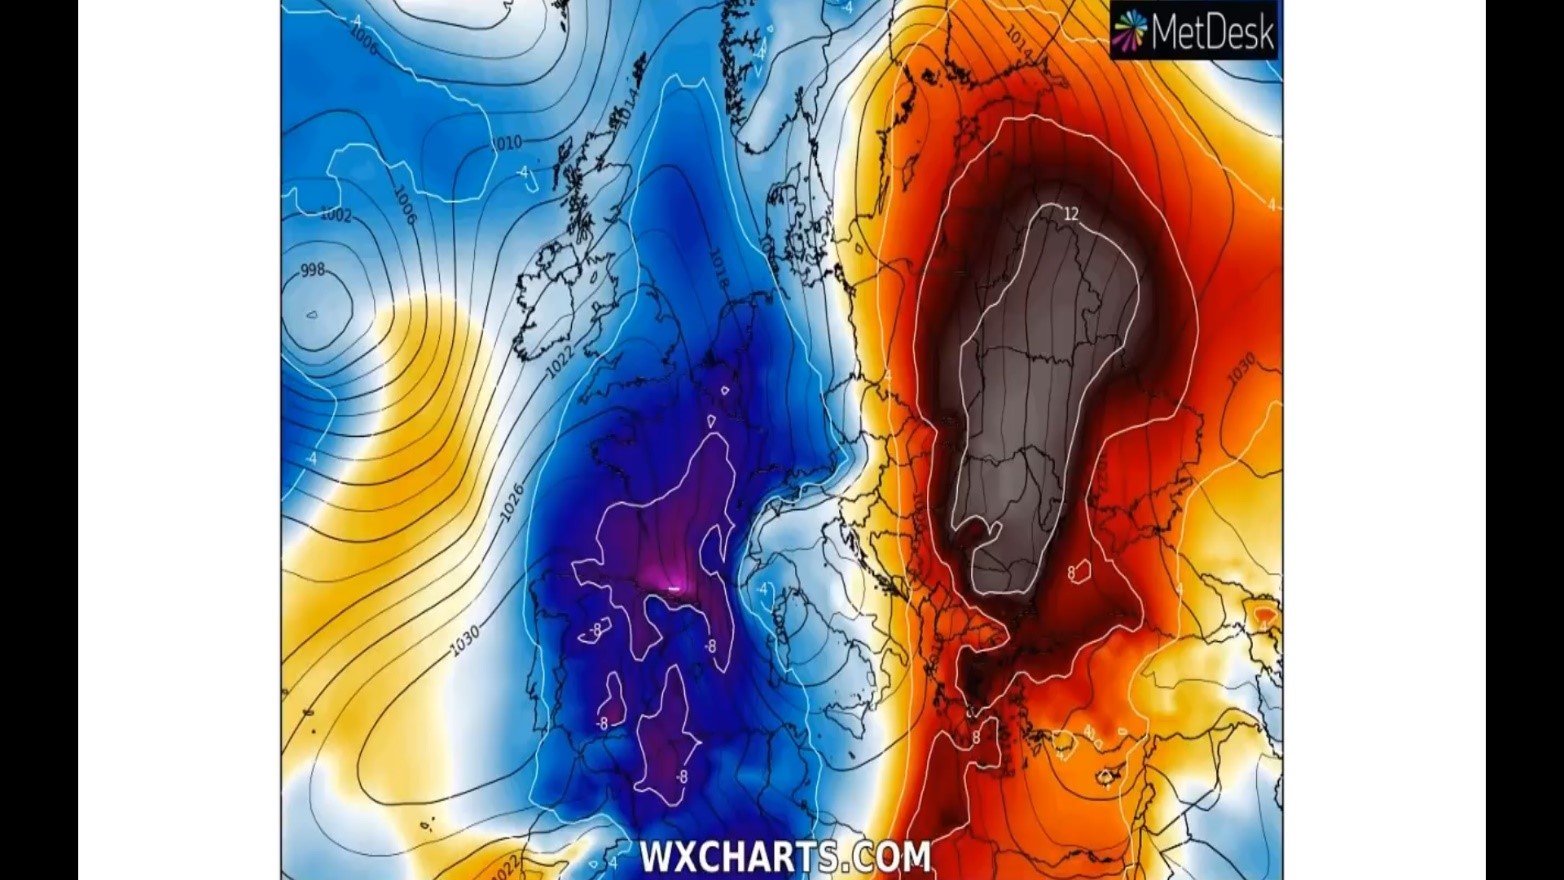
This is exactly what is seen in Europe. The same mix ups of their jet streams, where extreme heat is against extreme cold in a north-south orientation.
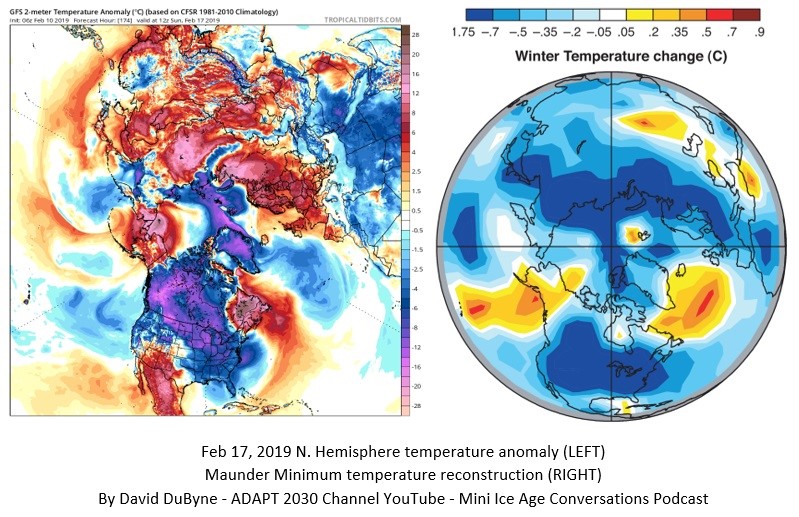
For comparison, I tried putting some of these GFS model on the left, side by side with the Maunder Minimum temperature reconstruction on the right. According to over 2000 peer-reviewed studies, changes in temperature and precipitation is observed during the Maunder Minimum. Can you spot any similarities in terms of cold in these two images?
Alaska is where the heat is; the Central US and parts of Canada is exactly where the cold is; a little bit south of Greenland, you get that heat pocket again; right through the middle of the Arctic is cold; also, North Africa is cold. I mean 90% of this map from the Maunder Minimum temperature reconstruction matches with today's 2019 GFS models. Yet no one has even considered to look into the past and see if there are some similarities that we should be talking about, to protect our global food source.
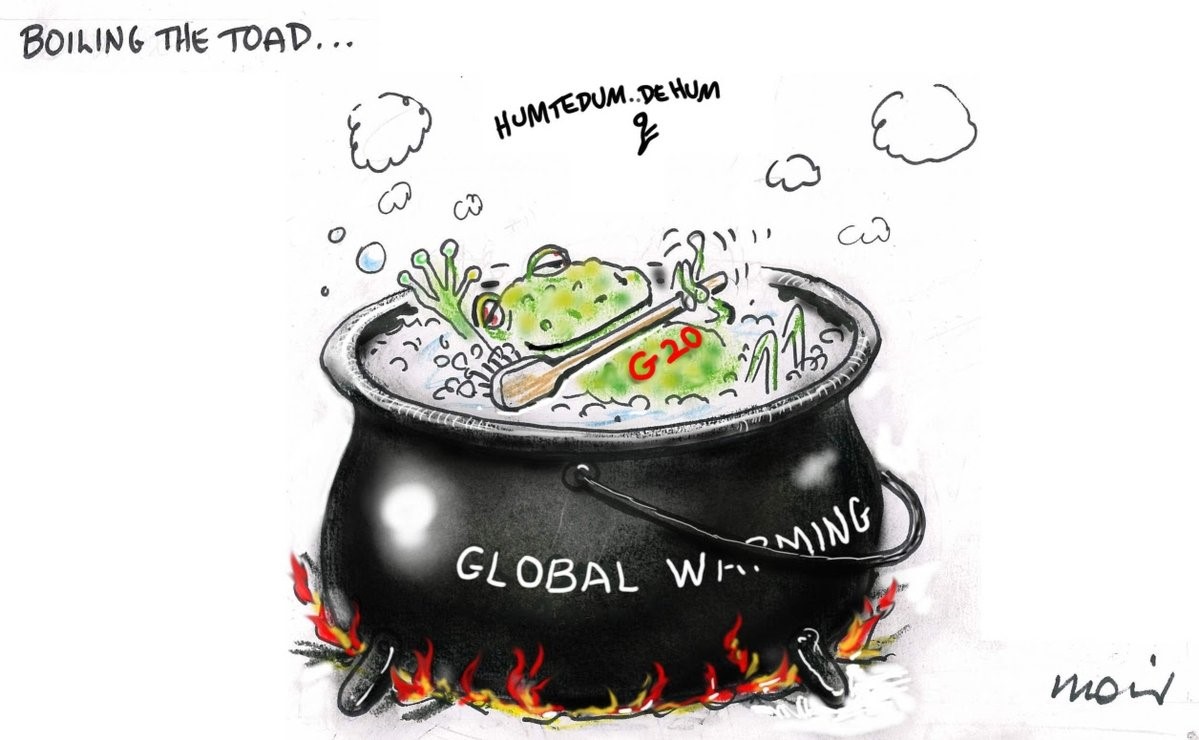
If you recall, back in the 1990's, this Global Warming hype first started with statements like: “We're going to boil like frogs in a pot.” Science was settled back then too, like they said.
I really don't know how they can they come out with a straight face and tell us back in the 1990s that science was settled, we are to boil like frogs in a pot, our kids would never know what snow was and every winter moving forward is going to get milder and shorter because the summers is going to be longer; and then just flip everything into: We told you that heat was going to cause record cold.
They never told us anything of this sort, they just flipped the narrative. Science is never settled. It never was and it will never be.
So I'm wondering what's next. Are they going to say eclipses are caused by CO2 too? Also, if we put a global CO2 tax, can we change the color of the moon back?
Thanks for reading, I hope you got something out of the article. If you like more information like this, I produce the tri-weekly Mini Ice Age Conversations podcast, 30 minutes of an in depth analysis on the GSM you can take on the go.
PDF of this Article Global Warming = All Time Record Cold?
FULL VIDEO Global Warming = All Time Record Cold?
"Help support the adapt 2030 channel on brighteon so we can keep grand solar minimum information free to access."
Volcanism in the Mini Ice Age, Which Eruption will Drop Earth's Temperate Next (385)
https://www.brighteon.com/6010048504001
***Mini Ice Age Conversations Podcast***
iTunes: https://itunes.apple.com/us/podcast/adapt2030
Soundcloud: https://soundcloud.com/adapt-2030
Libsyn: http://adapt2030.libsyn.com/
***Support ADAPT 2030 by Visiting Our Sponsors***
ADAPT 2030 & My Patriot Supply
Taking the Fear Out of Difficult Situations
2-Week Food Supply with 92 servings
True Leaf Market Organic & Heirloom Seeds
ADAPT 2030 True Leaf Market Link
ADAPT 2030 Amazon Grand Solar Minimum Book Store
https://www.amazon.com/shop/adapt2030
*** Today’s Story Links ***
Tim Ball: In Climate Propaganda, Normal Is Promoted As Abnormal https://www.technocracy.news/tim-ball-in-climate-propaganda-normal-is-promoted-as-abnormal/
Global Temperature models https://www.tropicaltidbits.com/analysis/models/?model=gfs®ion=us&pkg=T2ma&runtime=2019021006&fh=-72
smAsho mAsh Channel https://www.youtube.com/channel/UCz6fIPEhT2I71lAA112krnA
*** ADAPT 2030 Social Media Links ***
PATREON www.patreon.com/adapt2030
YOUTUBE ADAPT 2030 Mini Ice Age 2015–2035 Series on YouTube
BITCHUTE https://www.bitchute.com/hashtag/adapt2030/
BRIGHTEON https://www.brighteon.com/channel/adapt2030
STEEM https://steemit.com/@adapt2030
MINDS https://www.minds.com/ADAPT2030
MEDIUM https://medium.com/@globalcooling
FB https://www.facebook.com/Miniiceage
TWITTER https://twitter.com/adapt2030