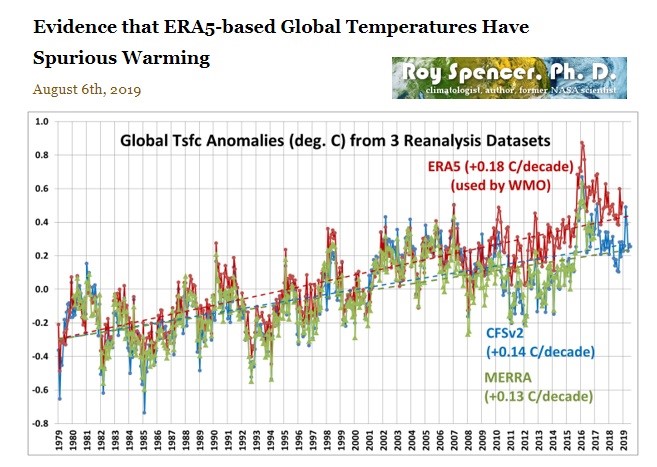
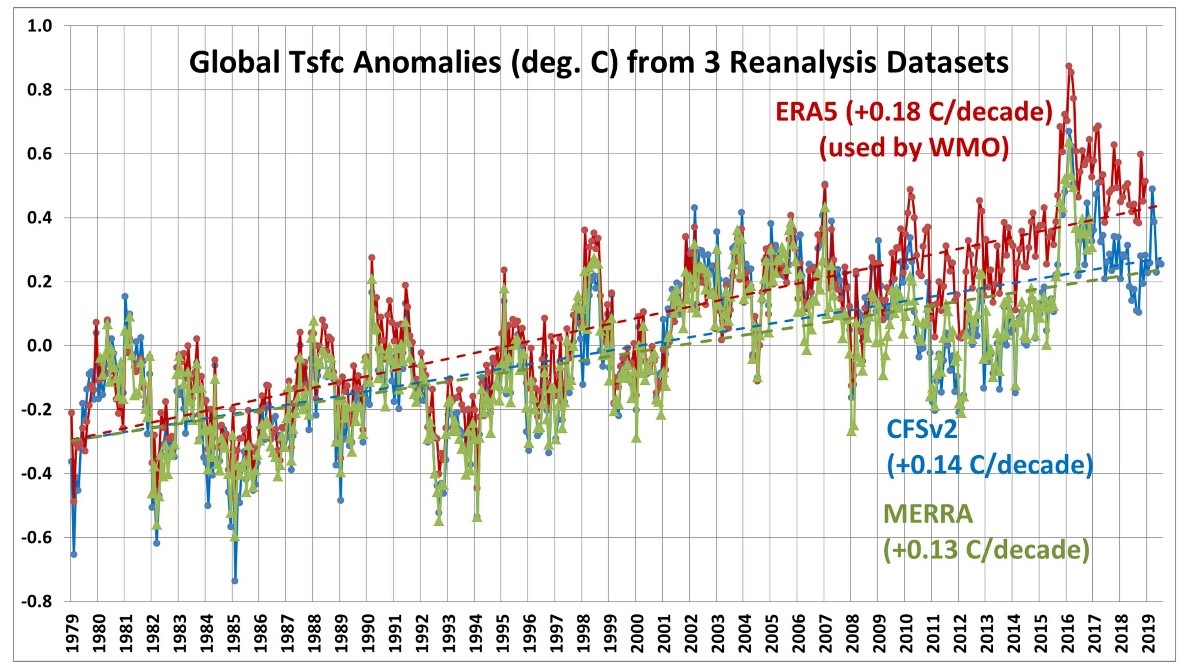
 Let us look at the departure that UAH talked about. Please note that these are also datasets used by the World Meteorological Organization, ERA5.
Greater Insight About The Effect Of The Sun’s Cycle
This video was originally published 8/8/2019
As you can see, it is 0.18°C above normal temperature, which is almost two tenths of a degree warmer. This kind of data model will of course get you the hottest temperatures ever, but it really is incredible how corporate media outlets can just bend facts and choose any set they want to show. This is not doing anybody any good.
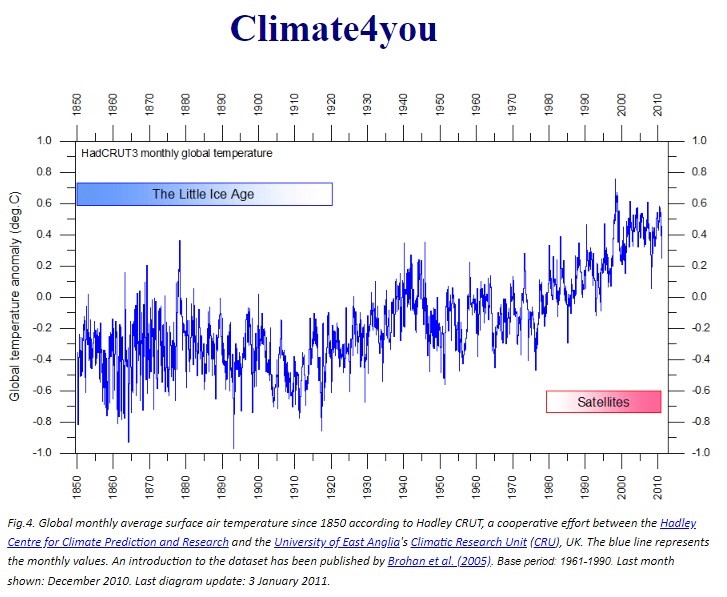
Case in point, from HadCRUT3, notice the far right of the chart. 2019 temperatures show temperature dropping. So at least the climate researcher here is putting out something decent, the drops in global temperature.
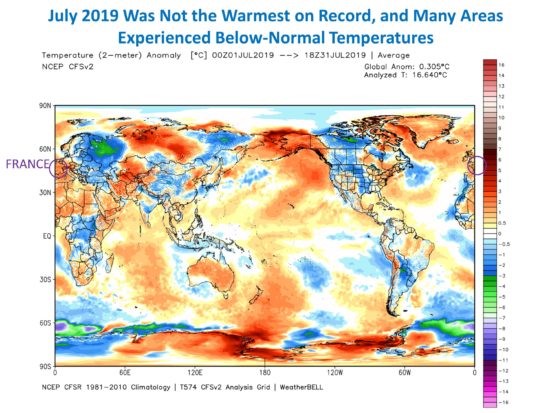
Again, France is being referred too often because of the heatwave that occurred recently. France is circled on the map so you can see how far out of bounds the heat really was. If it was that exceptional, it should be much, much darker red than it is. So, again, that was just a blown out 2-day event by the media, to prove a point.
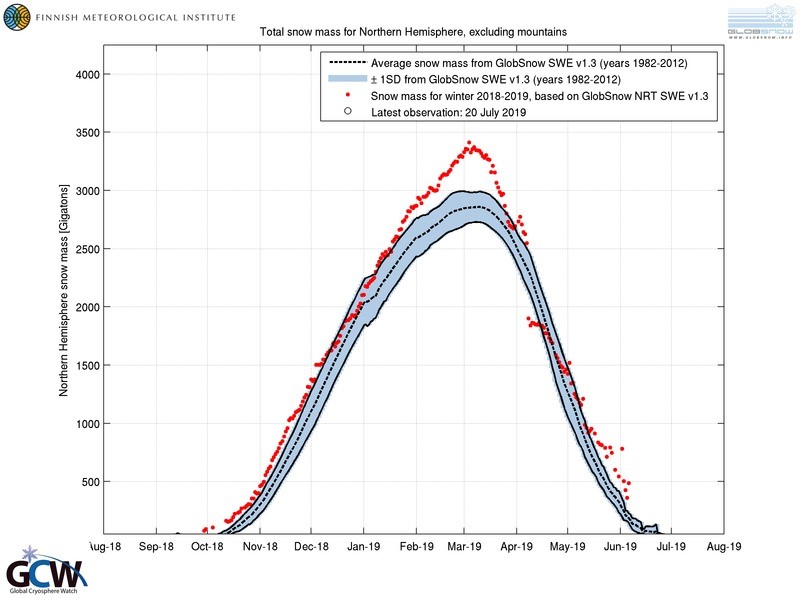
We are still having snow across the Northern Hemisphere, and excuses of warming oceans as the cause did not happen in 1998, and now, we are getting snows in June and July.
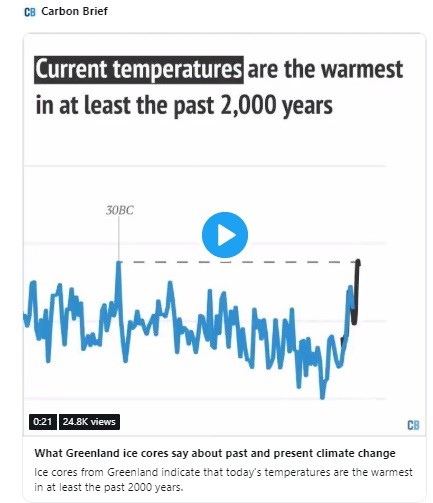
These unexpected events can be explained by cycles. Carbon Brief reported that the current temperatures are the warmest in, at least, 2,000 years. This means that it was as warm 2,000 years ago. The chart shows how temperature dipped and then came back up, which is the very definition of a cycle, a Grand Solar Minimum cycle specifically.
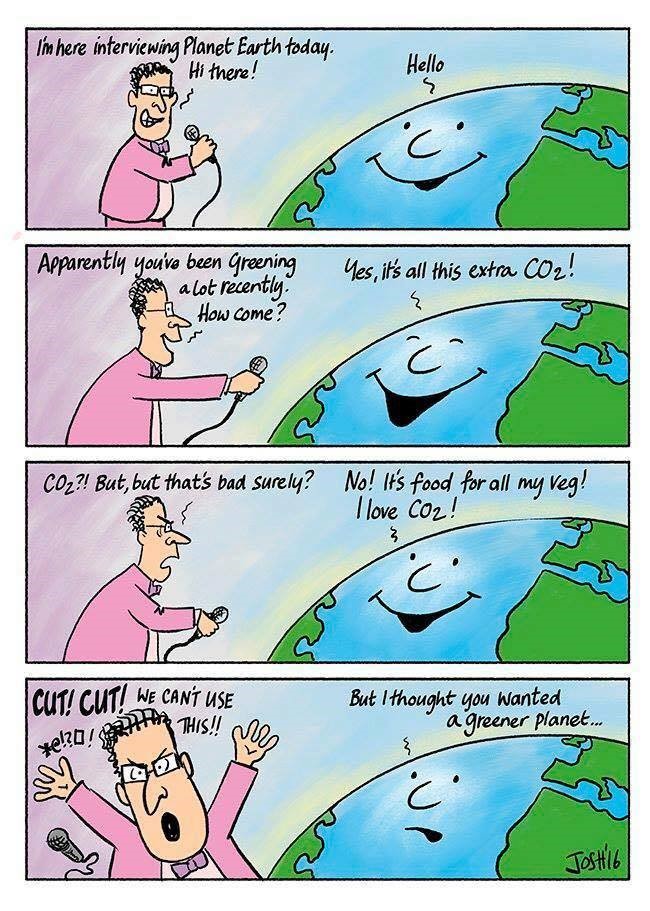
Graphics sum up how the corporate media would interview our planet, but as you can see, the corporate media are advocating for CO2 tax, but in reality, facts are saying that we do not need one because this warming is caused by a natural cycle.
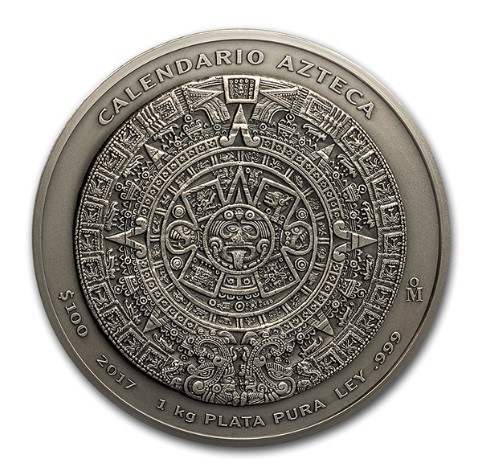
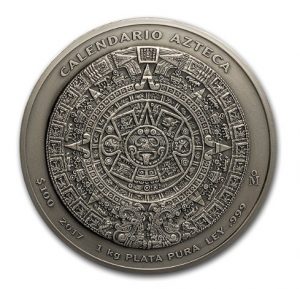
These cycles were known by ancient cultures as well. They left us messages that the cycle of economy is going to go through a severe contraction. Check out the silver coin, 1 kilogram, showing one of the most famous calendars that map through the heavens and the cycles. We have better instrumentation now, so our modern world should have even greater insight about the effect of the Sun’s cycle to the decreasing crop yields across the planet.
The pieces in the chess board that the government are moving across the planet, the economy that by all the means will contract, the population migration, and the food price rises are all intertwined.
And with all these economic contractions, people are starting to reevaluate what value is. As for you, what is value? What could be traded? What will be a monetary useable instrument, if you will, like gold, silver, shovels, seeds or cryptocurrency? In my opinion, our old debt system cannot hold on any longer, and there will be a shift to new mediums of value as we move through these next decades.
I talked about this in my new book, Climate Revolution. How the Grand Solar Minimum affected societies in the past, and the changes we are looking for in the future based on past cycles are explained in the first half of the book. The second half discusses solutions for you to prepare and be able to keep yourselves and you families safe during this transition period. Also guides to find niches for goods and services that are essential during this transition so you can prosper financially, mentally, physically, and spiritually, are also included in this book.
Climate Revolution is a ‘must read’ for the understanding of our Sun driven climate as we progress deeper into the new Eddy Grand Solar Minimum. Weather extremes leading to Global food scarcity and high food prices are here now, and this book describes the expected changes, how to survive & thrive during future challenging times with practical preparations.
NEW ADAPT 2030 Climate Revolution https://payhip.com/b/3sVi/af5d15cc7ddd65e
Thanks for reading, I hope you got something out of the article. If you would like more content like this, I produce the tri-weekly Mini Ice Age Conversations podcast, 30 minutes of in-depth analysis on the GSM you can take on the go through out your day.
PDF of this Article Arctic Temperatures, Greenland Melt & Global Measurements Don't Matter
FULL VIDEO Arctic Temperatures, Greenland Melt & Global Measurements Don't Matter
"Help support the adapt 2030 channel on brighteon so we can keep grand solar minimum information free to access."
Volcanism in the Mini Ice Age, Which Eruption will Drop Earth's Temperate Next (385)
https://www.brighteon.com/6010048504001
***Mini Ice Age Conversations Podcast***
iTunes: https://itunes.apple.com/us/podcast/adapt2030
Soundcloud: https://soundcloud.com/adapt-2030
Libsyn: http://adapt2030.libsyn.com/
***Support ADAPT 2030 by Visiting Our Sponsors***
ADAPT 2030 & My Patriot Supply
Taking the Fear Out of Difficult Situations
2-Week Food Supply with 92 servings
True Leaf Market Organic & Heirloom Seeds
ADAPT 2030 True Leaf Market Link
ADAPT 2030 Amazon Grand Solar Minimum Book Store
https://www.amazon.com/shop/adapt2030
*** Today’s Story Links ***
July 2019 Was Not the Warmest on Record
http://www.drroyspencer.com/2019/08/july-2019-was-not-the-warmest-on-record/
July Global Temperatures
http://www.drroyspencer.com/wp-content/uploads/UAH_LT_1979_thru_July_2019_v6.jpg
http://www.drroyspencer.com/wp-content/uploads/CFSv2-global-July-2019.jpg
Different global temperature sets
http://www.drroyspencer.com/wp-content/uploads/Reanalysis-3-datasets-1979-2019.jpg
Evidence that ERA5-based Global Temperatures Have Spurious Warming
Sea Ice Charts DMI August 05, 2019
http://ocean.dmi.dk/arctic/icethickness/images/FullSize_CICE_combine_thick_SM_EN_20190805.png
Total Northern Hemisphere Snow Cover 2019
https://globalcryospherewatch.org/state_of_cryo/snow/fmi_swe_tracker.jpg
Sea Ice Charts
August 05, 2019 sea ice chart 1979-2019
http://climate4you.com/images/IRAC%20JAXA%20ArcticSeaIceExtentSince20020601.gif
Greenland cumulative melt vs gain
http://polarportal.dk/en/greenland/surface-conditions/
DMI 80N temperatures in the Arctic
http://ocean.dmi.dk/arctic/meant80n.uk.php
Typhoons Asia Pacific
https://www.cwb.gov.tw/V7e/prevent/typhoon/ty.htm?
*** ADAPT 2030 Social Media Links ***
PATREON www.patreon.com/adapt2030
YOUTUBE ADAPT 2030 Mini Ice Age 2015–2035 Series on YouTube
BITCHUTE https://www.bitchute.com/hashtag/adapt2030/
BRIGHTEON https://www.brighteon.com/channel/adapt2030
STEEM https://steemit.com/@adapt2030
MINDS https://www.minds.com/ADAPT2030
MEDIUM https://medium.com/@globalcooling
FB https://www.facebook.com/Miniiceage
TWITTER https://twitter.com/adapt2030

