
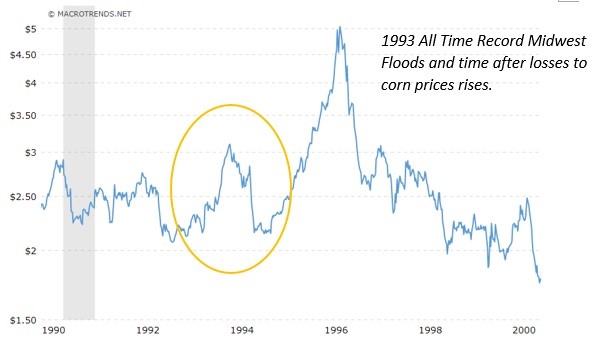
 The biggest floods to hit the USA Midwest crop growing belts since 1993 and 1927, this appears to be the largest event event ever recorded in that area of North America in the last 150 years. Since the trade war with China, more 6.7 billion bushels in storage of the 17 billion bushels total has been lost due to flooding and contamination. Going by 1993 price rises after the flood a jump of 30% at the minimum is forecast. Global grain production down 7% over the last two years and poor conditions in the fields will make refilling the silos difficult at best.
How Much Food Prices Will Rise After Midwest USA Floods
This video was originally published 23/3/2019
This article is a comparison between the Midwest 1993 flood and the flood that we had recently in terms of the way they drove up crop pricing in a 12-24 month period after the flooding. We then shall see which flood is more severe.
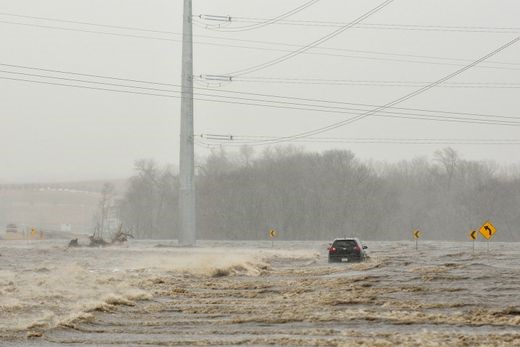
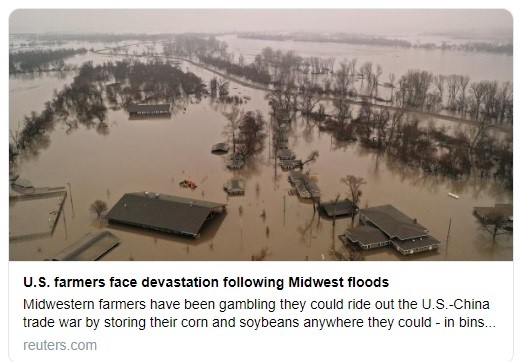
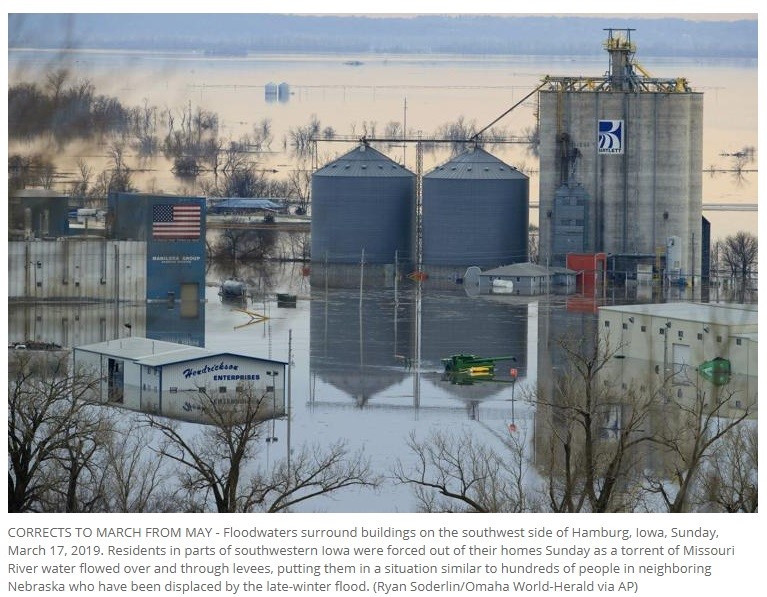
What you are looking right now, depicted in this image was experienced by at least seven states in growing zones of wheat and corn across the United States. This happened during the worst ever recorded flood in American history.
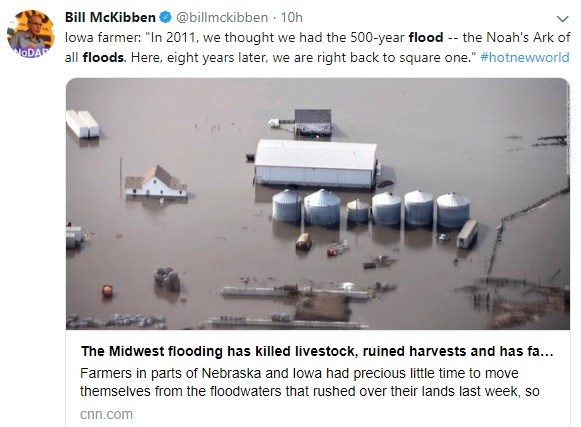
Iowa farmers were comparing the same event that took place in 2011, when they experienced the once in a 500-year flood, the Noah's Ark storm. Now, eight years later, we are back at square one. This image of storage bins brings a host of questions; How much grain was stored? How much was lost? How much of your food is going to increase in price in the next 12 months?
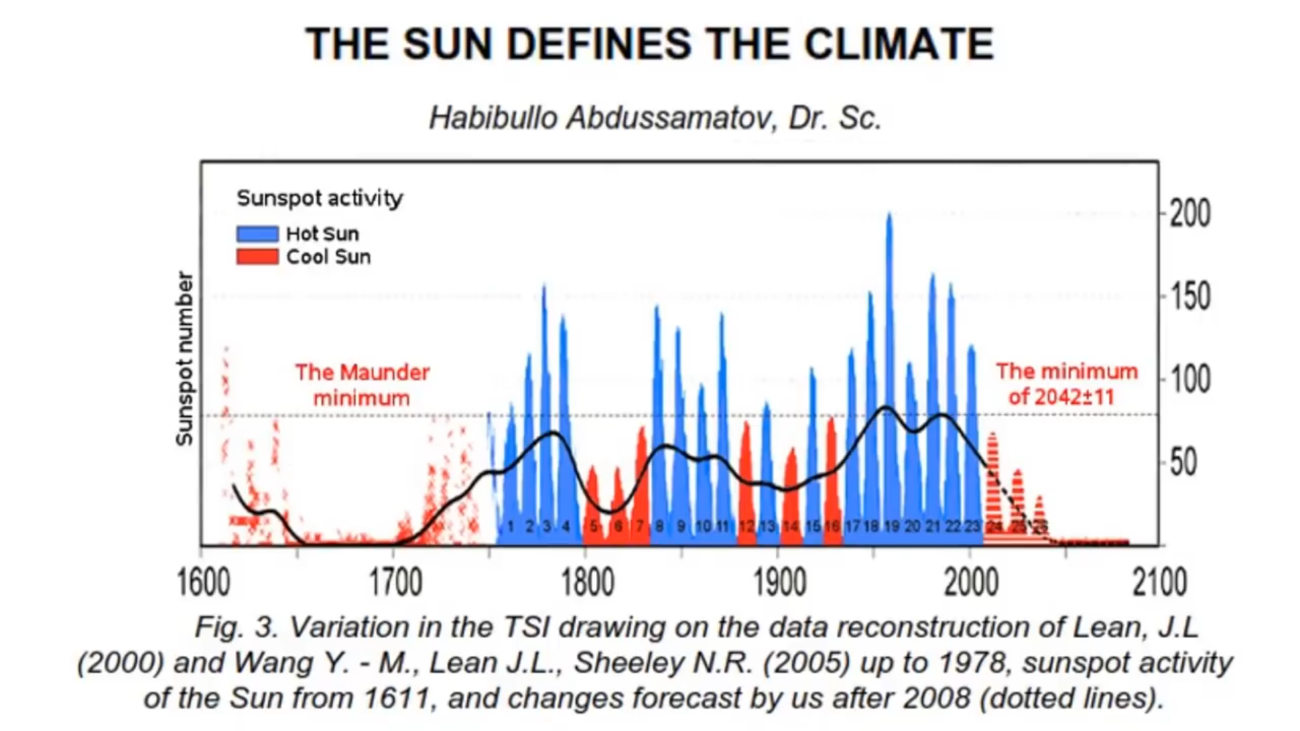
As we progress deeper into the Eddy Grand Solar Minimum, as shown in this graph, the solar activity forecast decline. So the storm intensity is going to get stronger every year. Therefore, these once in a 500-year and once in a 400-year storms will be normal as we move out to 2023.

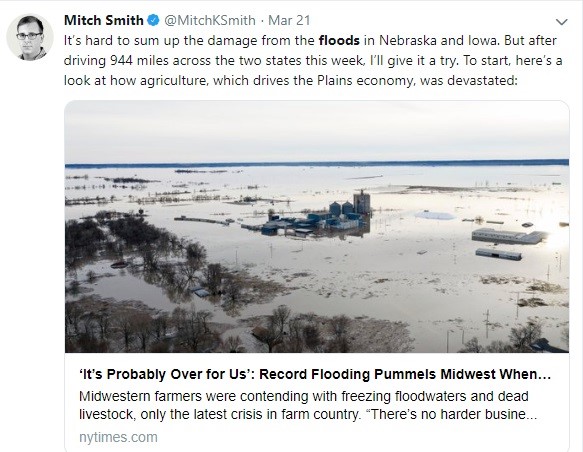
This one is an interesting article in the New York Times assessing flood damage as well. They did their own tour, driving about a thousand miles through effected areas.
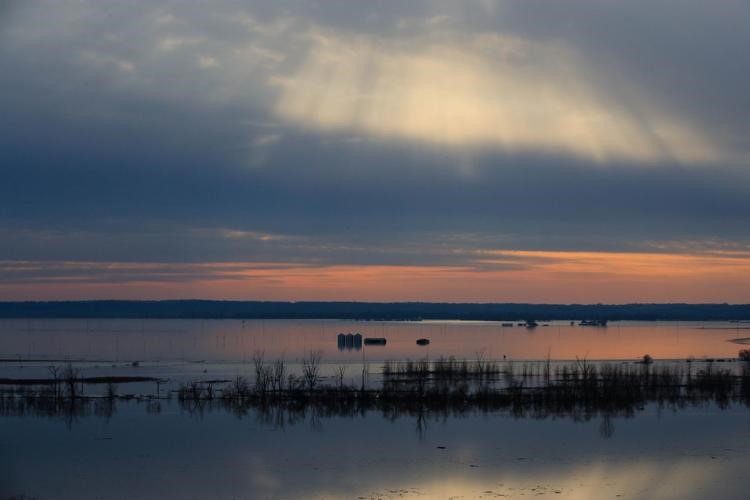
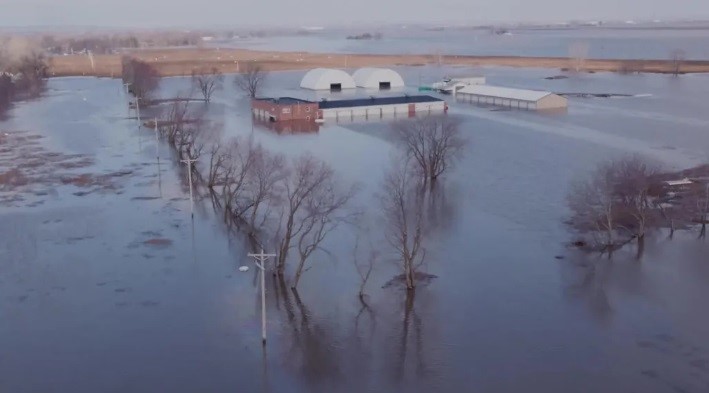
Notice this image, like the other images, the storage facility is completely submerged. You should note that every time water touches the grain, that grain is considered adulterated. They have to destroy the grains housed in that bin or storage facility if it was contaminated river water. To vacuum out top layers of grain, that must be inspected by USDA inspector by batch to get clearance. How many inspectors will be needed and how long will it take to inspect 13 states of damaged grain storage facilities?
Wherever you look across so many states, it is the exact same imagery, whether they are inland or riverside storage facilities, they do not matter. This is indeed a mega-flood.
Which brings us to Michel Schneider's site, the End of the American Dream. This article is making the rounds right now with a headline that says, Catastrophic flooding in the Midwest could last “for months”, and that is going to mean a dramatic drop in US food production.
The thing is with the US / China trade war going on, there is so much grain stored in America. Currently, in these seven states, at least 6.7 billion bushels of corn, soy and wheat are stored. This is 38% of all the total US supplies available at that time. Keep this number in mind, 6.7 billion.

Now however, as we look through these seven states, all that has been shown so far are these same images of inland deltas and seas forming by this massive once in a 500-year flood, yet again.
Grain storage facilities and farms, totally submerged. The planting season is definitely going to be delayed this year, and in so many places, they are not even going to be able to plant. We can then put a zero production yield in so many millions of acres.
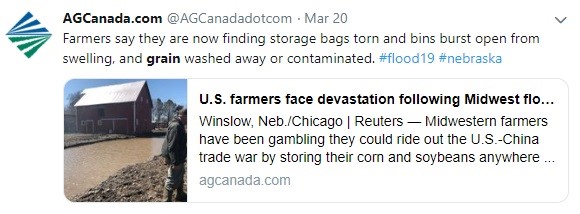
AGCanada had also talked about what farmers went through when the flood waters receded slightly. They found storage bags torn, bins burst open from swelling, grains washed away, as well as destroyed cattle farms. So are some farm machineries, roads, infrastructure and everything else that keeps the whole supply chain moving. Take note of the last sentence, there is so much grain stored because of the US trade war.
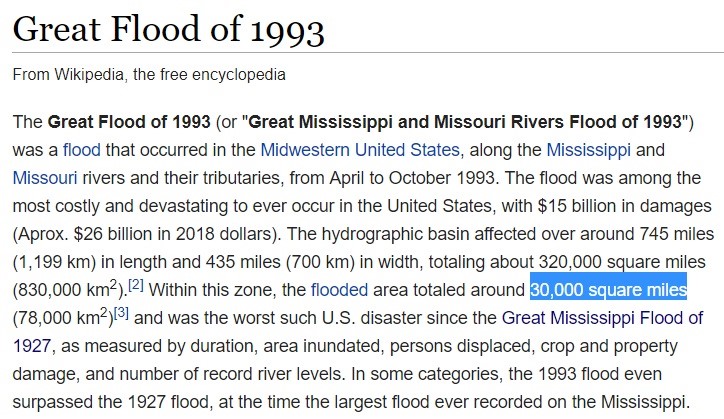
So a few of my subscribers wrote, saying that I have to check out the 1993 floods, The Great Midwest Flood. And I thought maybe this can give us an indication of how much our food prices will rise based on the same flood events. In my opinion however, the flood that occurred recently is more intense.
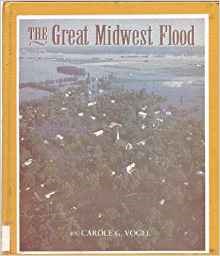
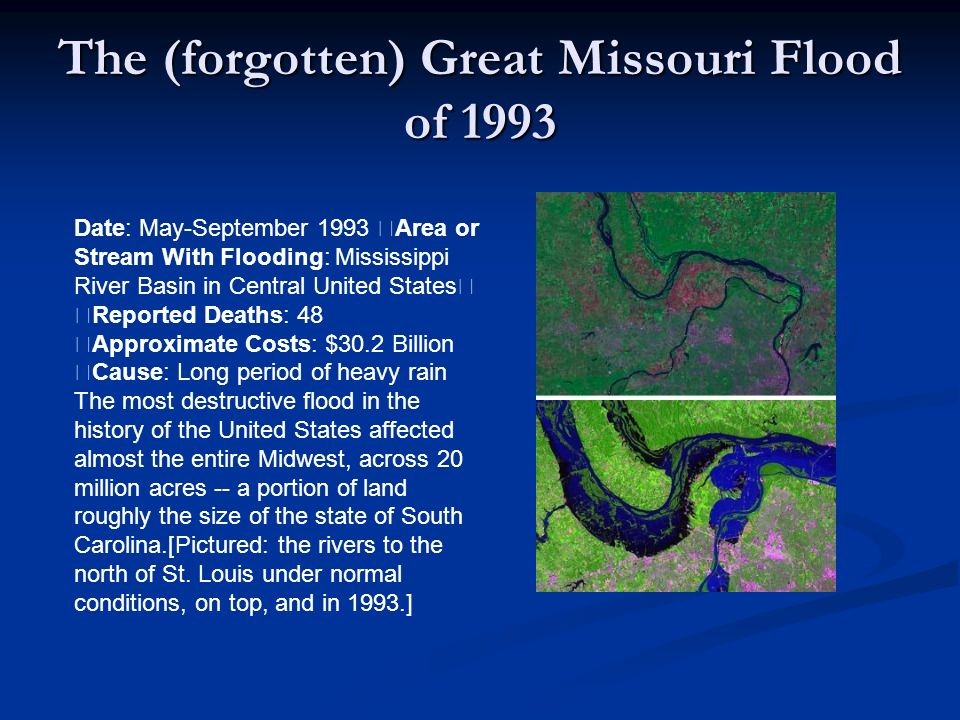
The Great Missouri Flood of 1993 occurred near St. Louis Missouri. From this image you can see how much the rivers had swollen from pre- and post-flood, with 30 billion worth of damages.
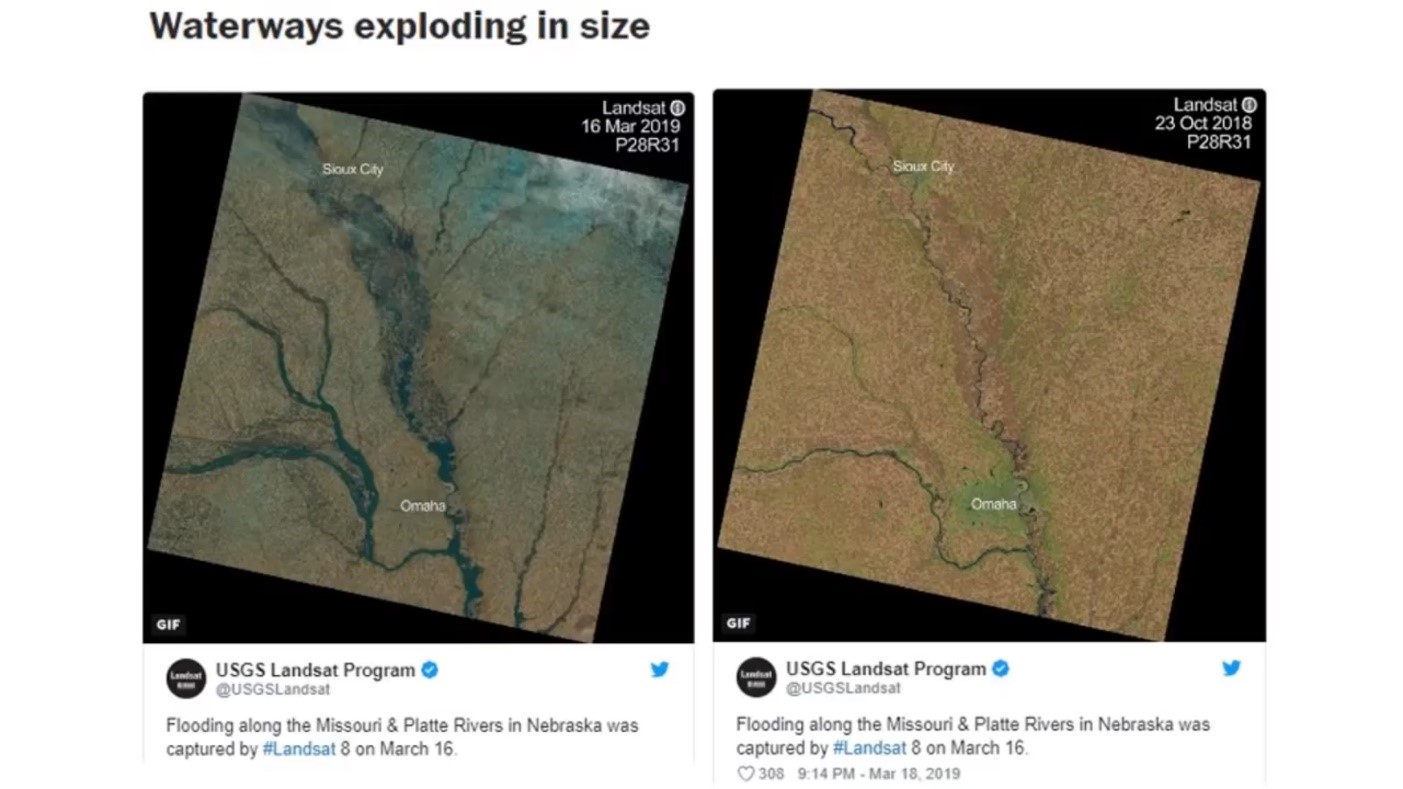
If we compare to what happened in Nebraska, we see the same things. Rivers were swollen from before and after photos, but this is way further north up in the watershed flowing to the Mississippi.
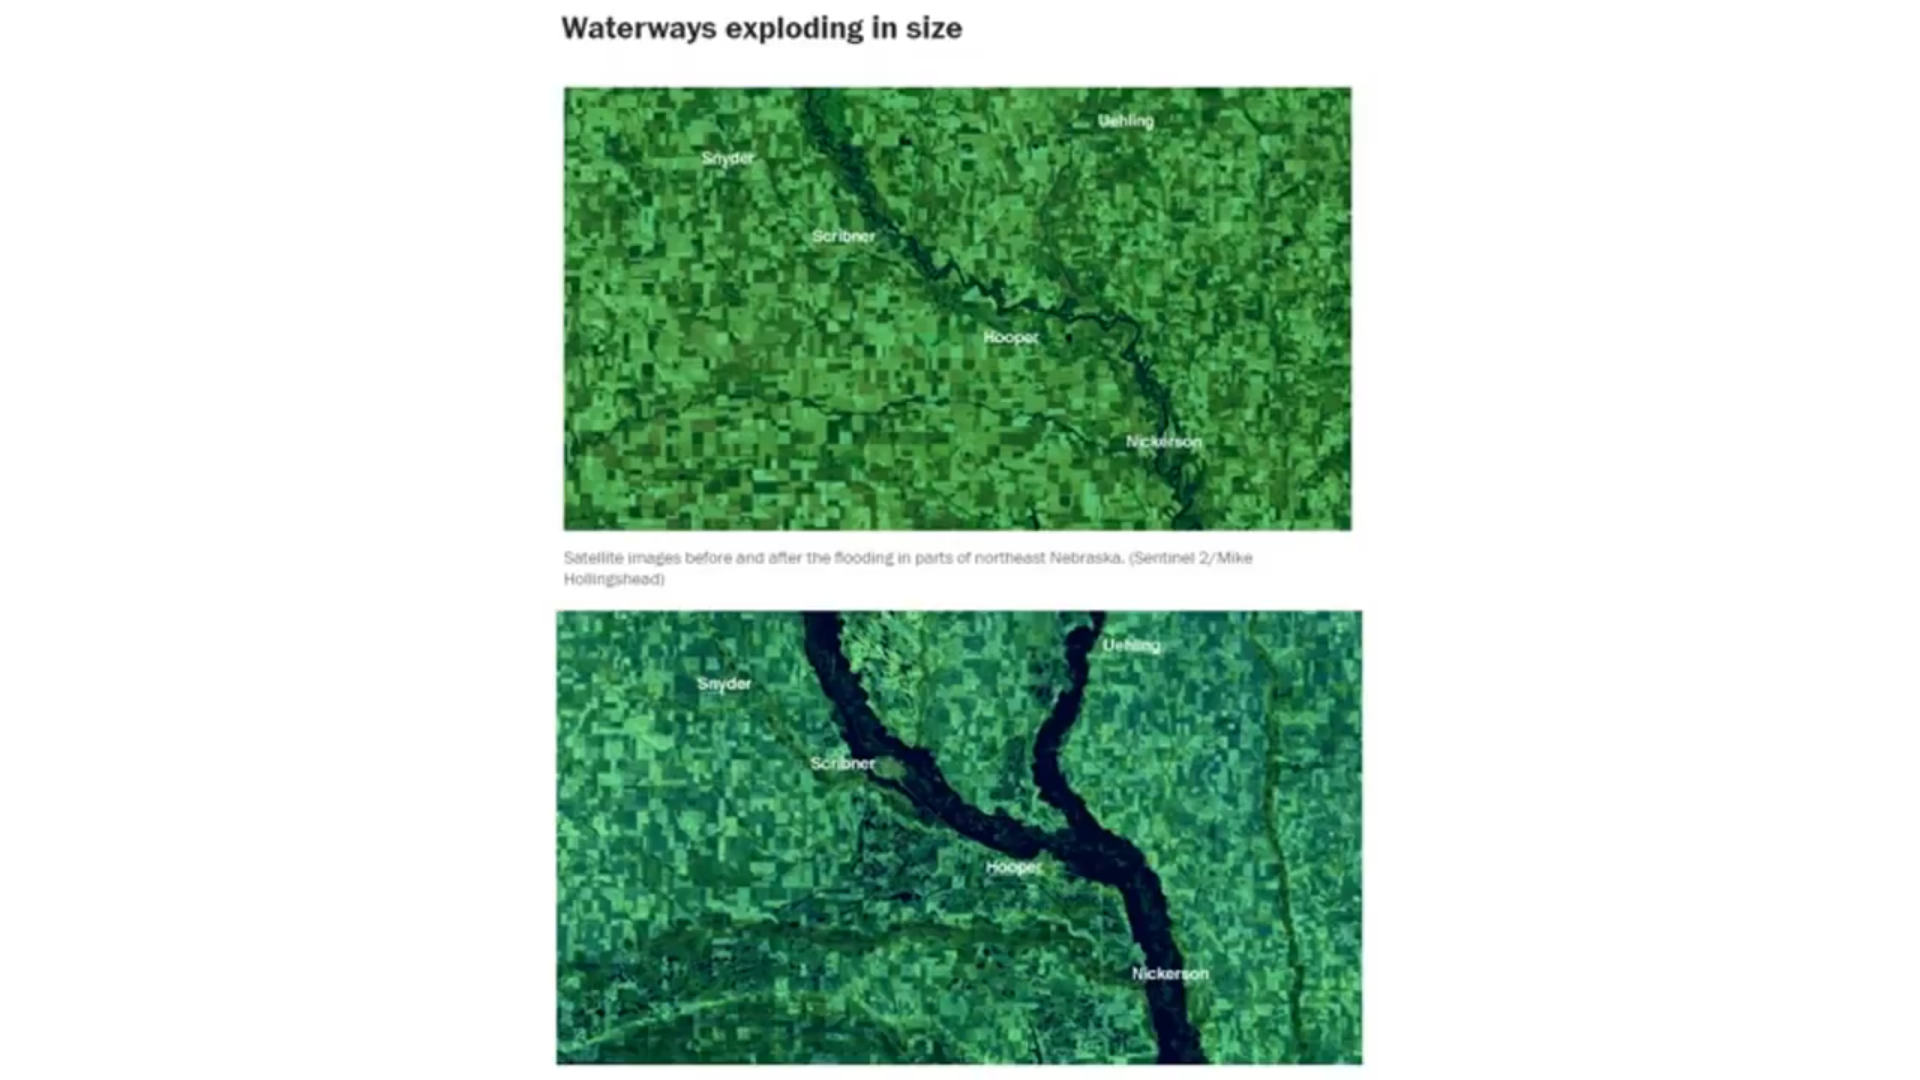
Also inland deltas were being formed much like the Okavango Delta in southern Africa.
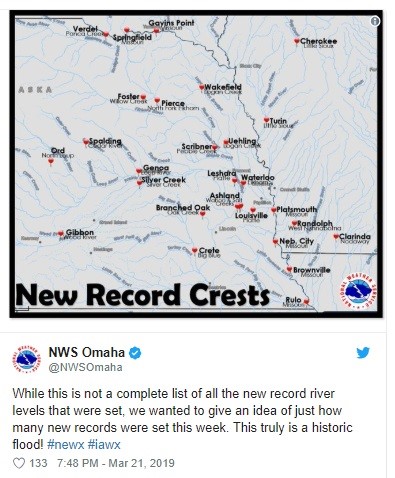
One of the reasons why I think this recent event is more intense than the 1993 flood is that 20 new record crest were set just on this map in Nebraska alone. As you go around in places like Iowa and Missouri, you start to see other record crests that happened, which did not happen in the 1993 flood.
Meanwhile, these storage bins here looked like they are elevated, but it is hard to tell if there was any water seepage. Here is the thing though, even if only the bottom, say the bottom 3 feet or 5 feet got flooded and that thing is over a hundred feet tall, the entire grains stored in that bin needs to be destroyed. It is not allowed to just scrape the top 90 feet off that and sell it without a USDA inspector first checking for contamination.
So now, we can only wait to see how much flood damage they truly had, and how much of those that have been stored were inundated.
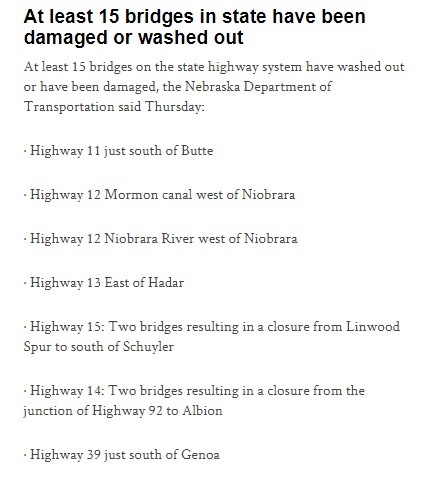
In addition, compared to the 1993 flood, 15 bridges in Nebraska were washed away during this recent flood, dams overtopped due to tidal waves and tsunamis of water that rolled downstream. These floes were around two miles wide ripping across and washing out interstates, toppling interstate bridges and gouging four-lane highways at the pilings below.
This is just a small beginning. I hope you do your own research. Lists of topics talked about in these news stories are written at the end of the article.
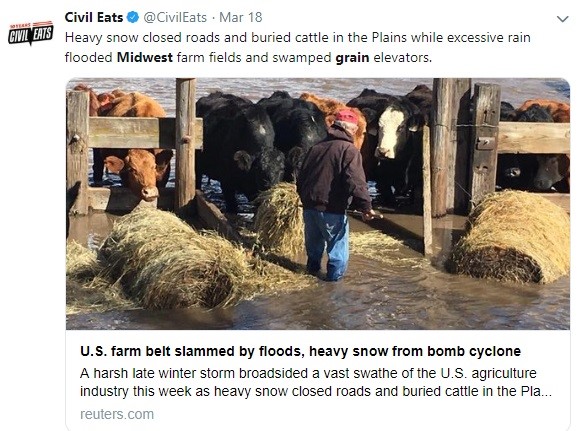
Anyhow, when you see images like this, cattle being fed in a foot deep of water, you absolutely know that the planting season will be affected this year because of this event.
Similarly, during the great flood of 1993, 30,000 square miles were flooded. Now, what was interesting is, they are already putting the totals and they have not even gotten all the aerial surveys yet.
Information on damage totals is not yet in because water coming out, of say Nebraska is still making its way, as of now, down to the Mississippi. If we survey through the side tributaries that were flooded, the Mississippi is absolutely going to flood to record levels, and that is where the major grain storage facilities are.
Hopefully, by then, they would have built levees and protection walls around these largest grain holding facilities in the US, but then, you saw many levees that were overtopped during Katrina should have also been shored up.
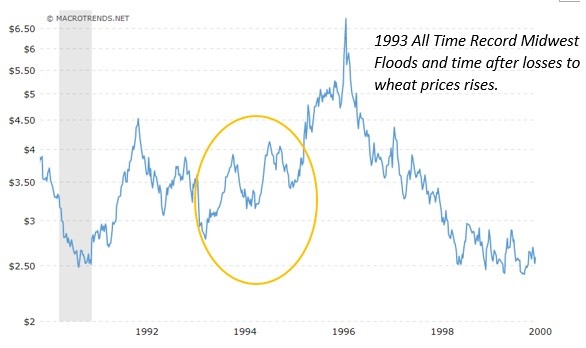
Now, let me take you back to 1993 record of Midwest floods and how much corn prices rose 12 months after the flood. It was about roughly, a 30% rise. The same rise was found in wheat prices. I'm only targeting the first 12 months after this flood event in this analyses.

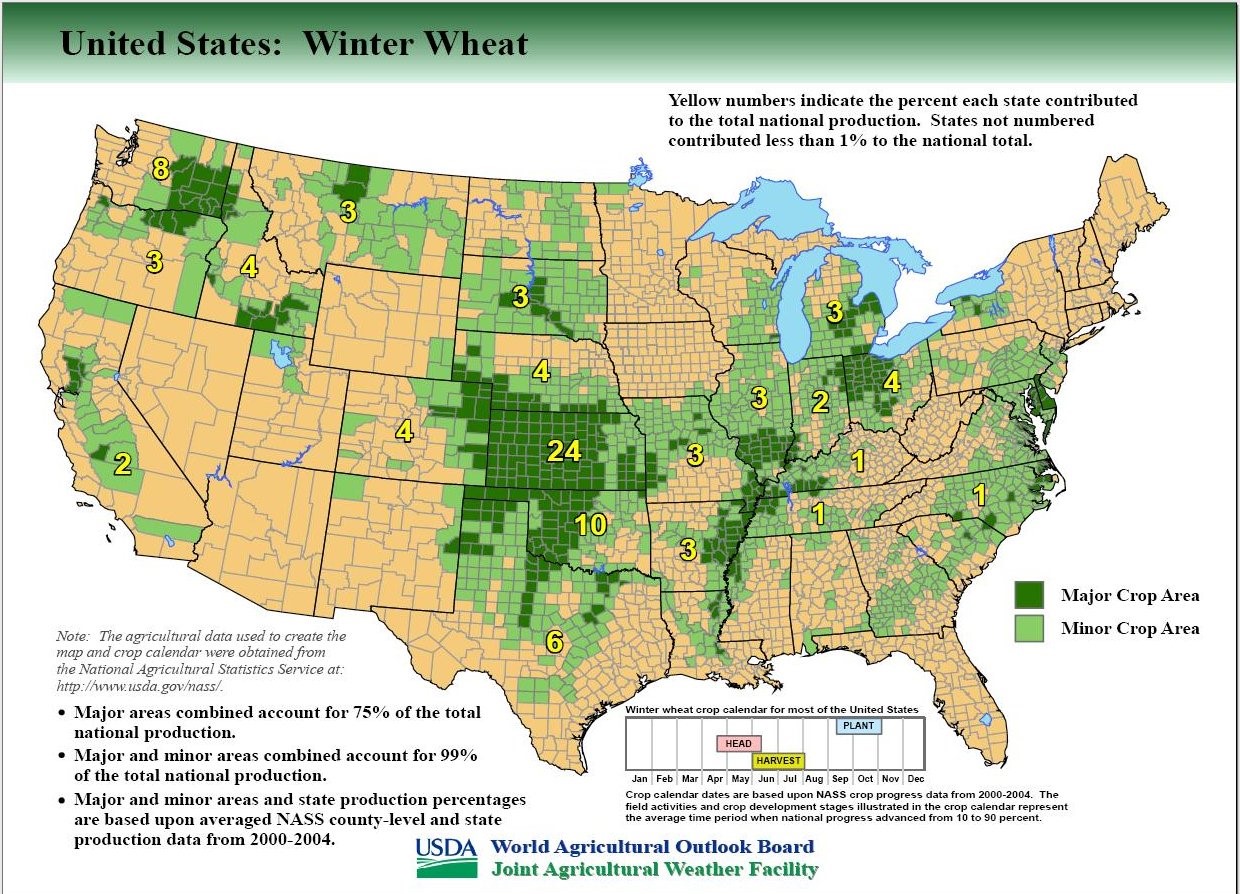
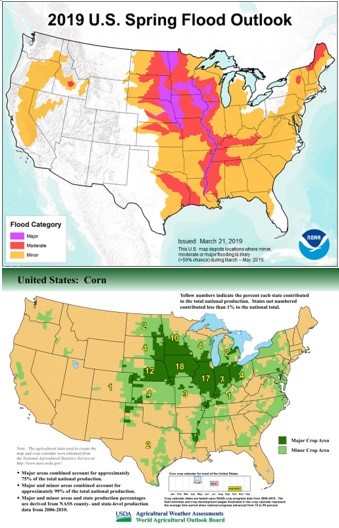
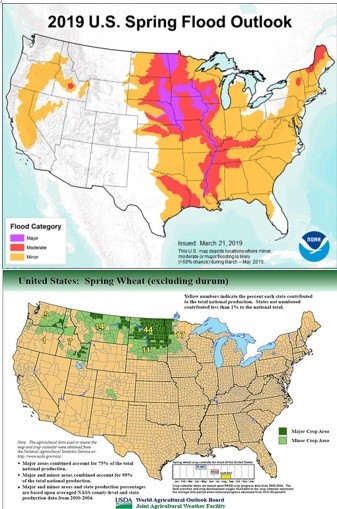
Now, we add in the Spring Flood Outlook. These maps show the grow zone areas in the US. The bottom left is for corn, the top right is where the winter wheat is produced, and then the bottom right is for the spring wheat cultivation areas of the US.
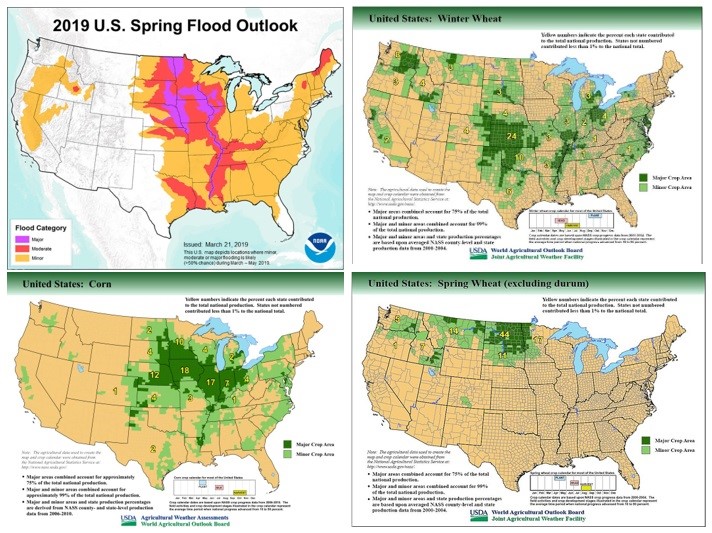
This comes off NOAA, and this is the forecast for US spring flooding. Let us really focus on the purple and the red. Yellow can be discounted because I think it is more of a scare factor. We can then start to match up these maps on where the major catastrophic, epic, and all-time flooding has been, with the moderate flooding, which is still a massive flooding.
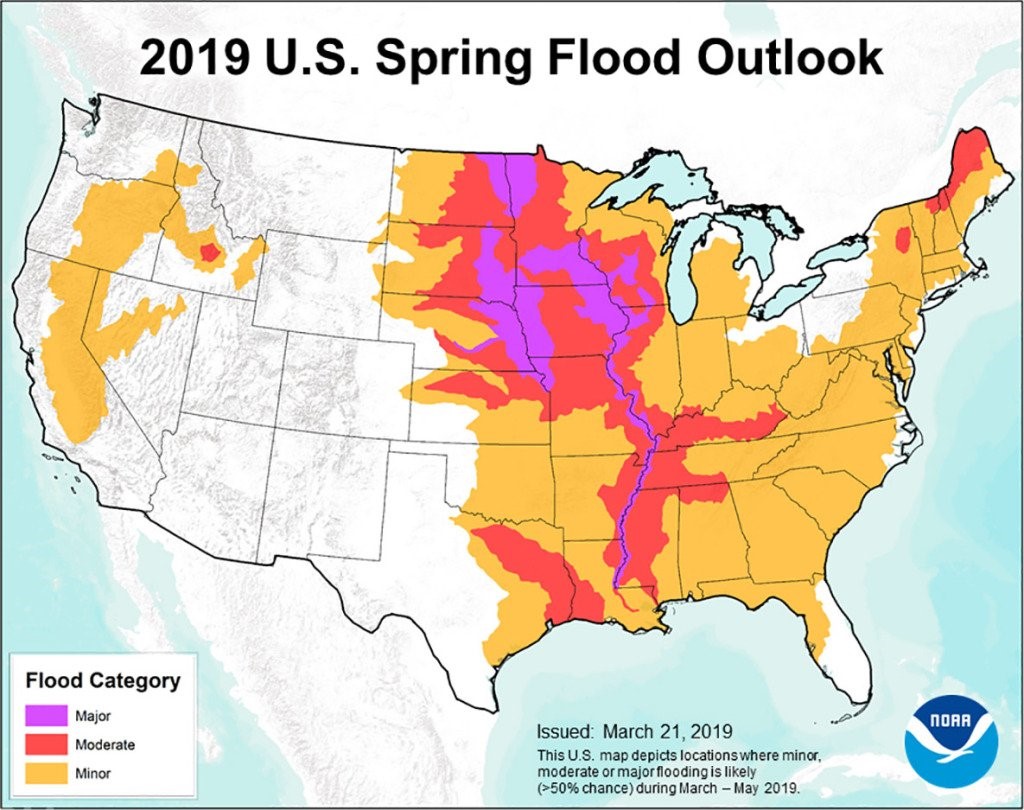
Starting over here in zone 24 right in the middle, that is Kansas. When we move East where we can see the Mississippi River, under number 3, that is Iowa. Follow that whole basin down and you see a lot of production there right along the Mississippi. All of those areas are going to be taken offline.
Kansas and Oklahoma might benefit because they suffered drought last year. This extra rain is going to benefit some areas, but part of northern Kansas will go offline as well.
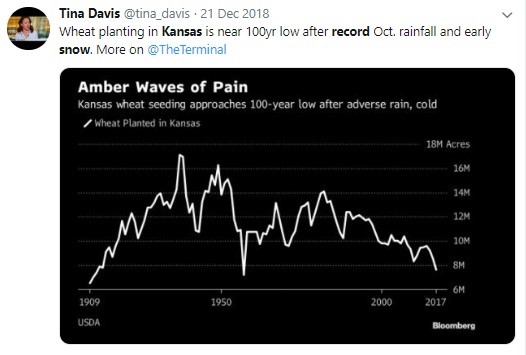
Speaking of Kansas, Amber Waves of Pain, this came from 2018. Kansas was then near a 100-year low in planting after the record October rainfall and early snowfalls. So, we have record rains and late season planting in the exact same areas.
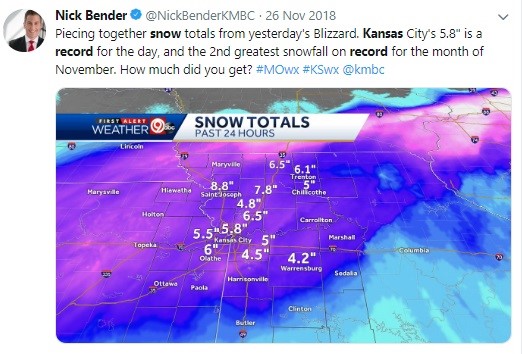
This is a glimpse to what the previous article referenced to, the second greatest snowfall on record for the month of November. New snow record totals is being set now in Kansas City.
These are the types of events that happen during the intensification of a Grand Solar Minimum. This is what we need to talk about, so I cannot yet understand why the mainstream media does not want to discuss these issues.
On the spring wheat, we are getting to Minnesota and Dakota.

When this Spring Wheat map is overlaid with the Spring Flood Outlook map, this major catastrophic flooding wiped out, at least 25% of all the spring wheat growing areas. That is not going to get planted on time. The fields are also below normal temperature and still incredibly wet. Spring wheat in the United States is then also down.
Taking a look in corn growing areas, zone18 is Nebraska and 17 is Iowa. These are were where the major floods happened recently. Governors of these states from their helicopter view said that these areas became inland seas. How do you think crop production and planting is going to go in those places?
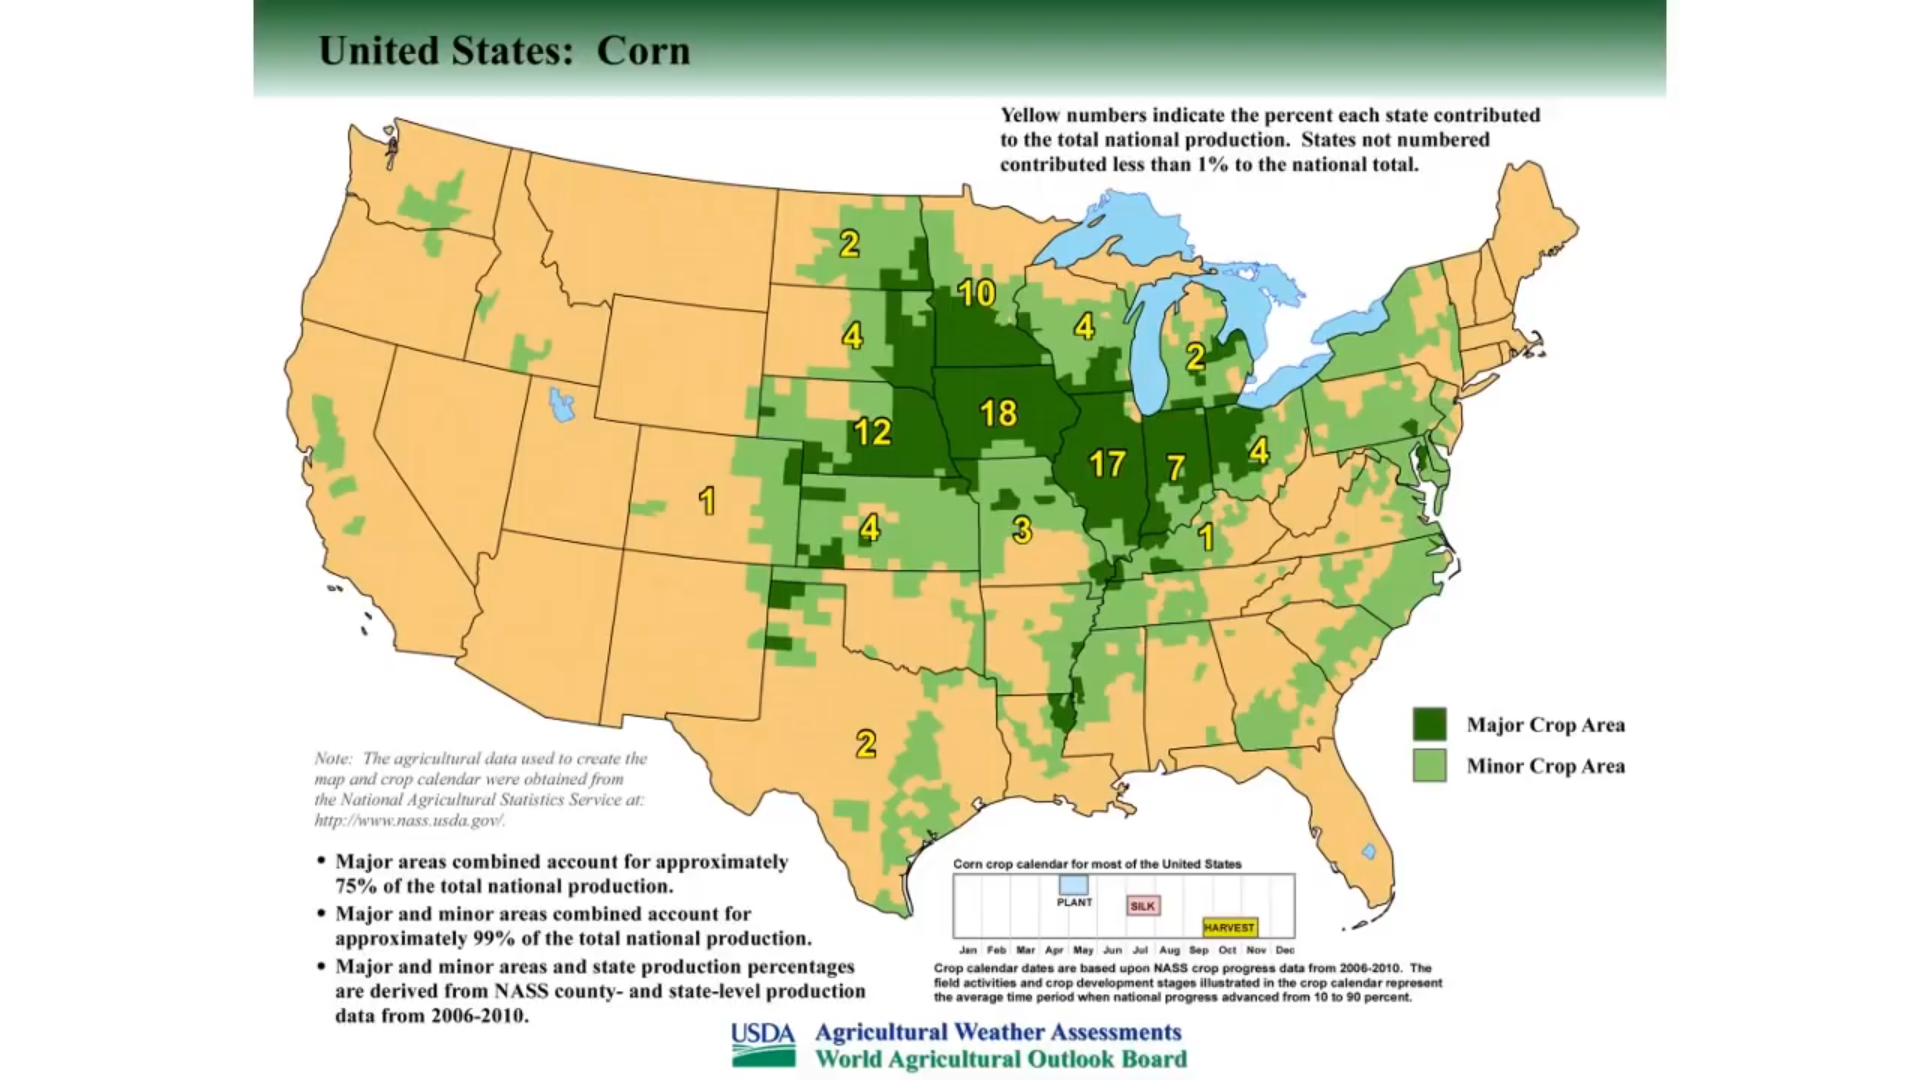
If we overlay the flood maps again, it looks at least 50% of the corn growing areas are going to go offline. Could they still plant these later with GMO? It is possible. But what will happen if the same thing happens where early frosts and early snows occur? They will not get a crop out.

Another caveat and the thing that did not happen in the 1993 floods was because of the the trade war with China, an enormous amount of grain stockpiles were being held in the silos and bins locally, even in farm facilities, secondary facilities, and in regular warehouses. So referencing off of Michael Schneider's article, that 6.7 billion bushels of stored grain in the flood zones in those 7 states are so far, just preliminary estimates of almost all that is flooded.
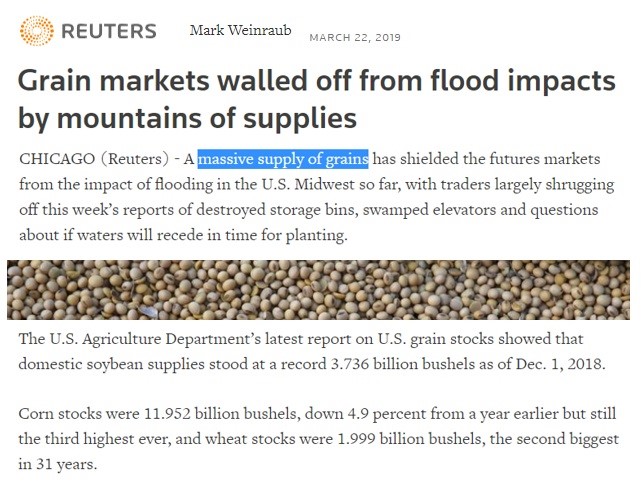
So if we take a look at the USDA report on stored grains, soya beans is at 3.7 billion bushels, corn is 11.9 billion bushels, and wheat is at 2 billion bushels. Adding all these, you come out to 17.6 billion bushels throughout the United States, and then we need to subtract that 6.7 billion bushels. Literally a third of all the grains stored in America has just been lost to this flood. Not only that this will cause price increase, but affected places needs to plant to try to make up for the losses and refill the bins, if you will, for this year. This is not going to happen; it will be impossible.
The yield will come in so low because of the non-planting of these millions of acres. Zero production has already been forecast for millions of primary acres, as well as a decrease in per acre yield due to poor conditions for growing. Anyway, after subtracting that 6.7 billion losses, that then leave us a total of 10.9 billion bushels.
Question, how do you think the US government and media will distract the populace from doubling food prices?
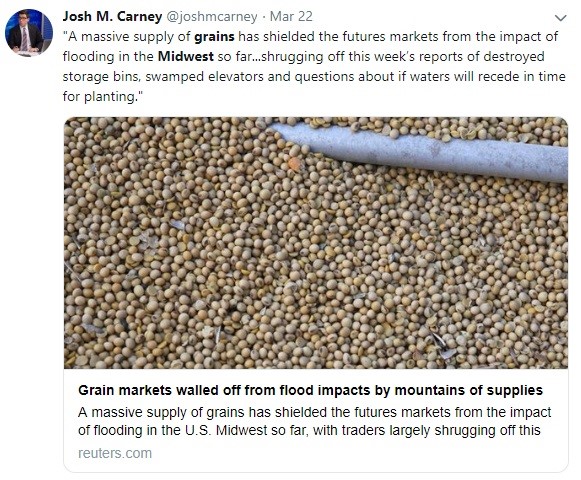
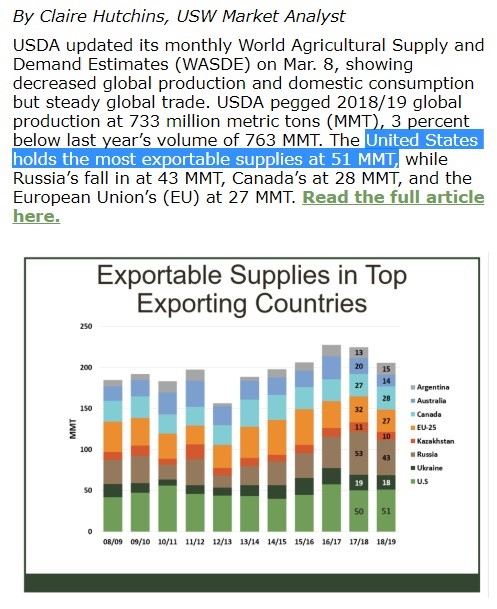
From another article off Reuters grain markets are walled off from flood impacts by mountains of supplies. In my opinion, this may be true, but once the assessment comes in and they know exactly how much is lost, this is where the increase in futures prices will come. This is not a piece of financial advice though, nor the rest of the article as I will discuss how the pricing will be. This is just an indication, by just looking at what happened during the 1993 flood. Can we gauge the behavior of food prices might be, moving forward?
Another caveat is also seen due to a decrease of global grain production by 3% because it was down 4% during prior year as well, so we are now looking at 7% global decline in grains over the last two years. So we lost all this grain, and it is going to be more difficult to grow new grain. Prices might move a little more than what is expected.
Let us take a look at the futures market off the CME Group for delivery month. I am using 30% as what had happened in the 1993 floods for corn and wheat. So if we are using 30%, we are taking out the initial May pricing call at the prior settle at 376. When it comes down to the December 2019 call, that 400 should be around 488.
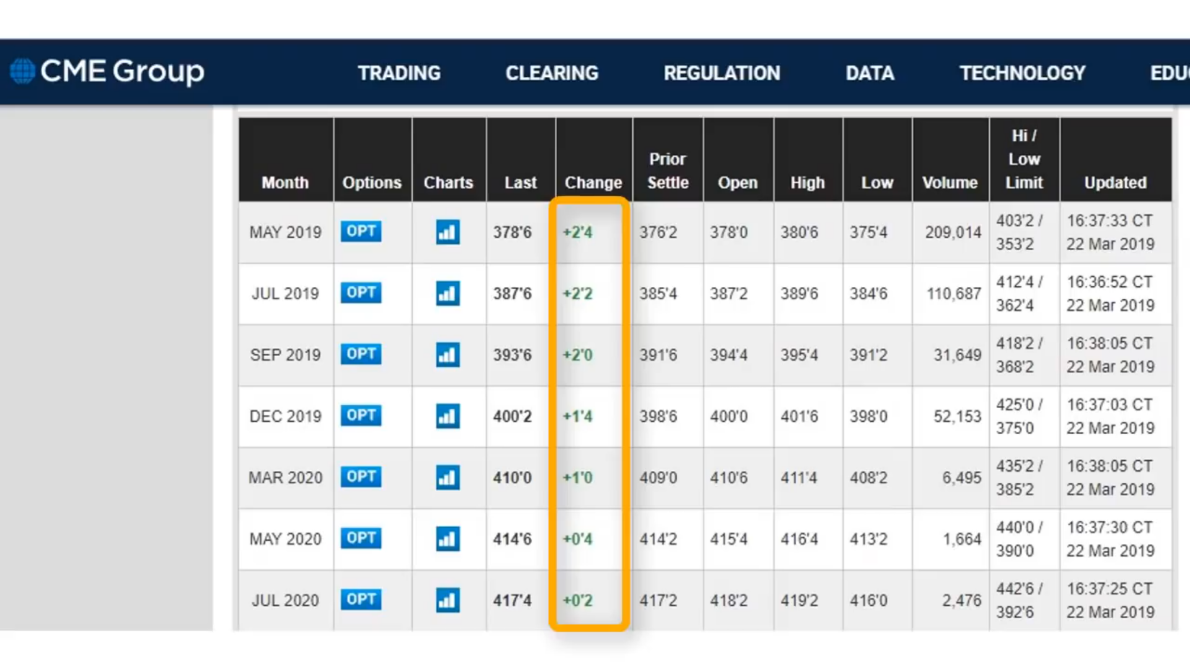
Again, this is not a piece of financial advice, this is just my own assessment based on the 1993 pricing, moving forward. Bear in mind that there are a few other things happening and intertwining at this time, so I think these prices based on 30% might even be a little low.
Thanks for reading, I hope you got something out of the article. If you like more information like this I also produce the tri-weekly Mini Ice Age Conversations Podcast, 30 minutes of in depth analysis on the GSM you can take on the go.
PDF of this Article How Much Food Prices Will Rise After Midwest USA Floods
FULL VIDEO How Much Food Prices Will Rise After Midwest USA Floods
"Help support the adapt 2030 channel on brighteon so we can keep grand solar minimum information free to access."
Volcanism in the Mini Ice Age, Which Eruption will Drop Earth's Temperate Next (385)
https://www.brighteon.com/6010048504001
***Mini Ice Age Conversations Podcast***
iTunes: https://itunes.apple.com/us/podcast/adapt2030
Soundcloud: https://soundcloud.com/adapt-2030
Libsyn: http://adapt2030.libsyn.com/
***Support ADAPT 2030 by Visiting Our Sponsors***
ADAPT 2030 & My Patriot Supply
Taking the Fear Out of Difficult Situations
2-Week Food Supply with 92 servings
True Leaf Market Organic & Heirloom Seeds
ADAPT 2030 True Leaf Market Link
ADAPT 2030 Amazon Grand Solar Minimum Book Store
https://www.amazon.com/shop/adapt2030
*** Today’s Story Links ***
Flood forecast map NOAA https://pbs.twimg.com/media/D2Ss6Y9WkAUO93c.jpg
Gov. Kim Reynolds on Iowa flooding: 'It looked like an ocean'
List 15 bridges out Nebraska
CME corn futures
Corn and wheat futures pricing
https://www.macrotrends.net/2534/wheat-prices-historical-chart-data
Cloud Image https://pbs.twimg.com/media/DV4y096VQAAJUxn.jpg
Food safety chart https://pbs.twimg.com/media/D18jFIUWoAExzxX.jpg
Grain markets walled off from flood impacts by mountains of supplies
Catastrophic Flooding In The Midwest Could Last “For Months”, And That Is Going To Mean A Dramatic Drop In U.S. Food Production
*** ADAPT 2030 Social Media Links ***
PATREON www.patreon.com/adapt2030
YOUTUBE ADAPT 2030 Mini Ice Age 2015–2035 Series on YouTube
BITCHUTE https://www.bitchute.com/hashtag/adapt2030/
BRIGHTEON https://www.brighteon.com/channel/adapt2030
STEEM https://steemit.com/@adapt2030
MINDS https://www.minds.com/ADAPT2030
MEDIUM https://medium.com/@globalcooling
FB https://www.facebook.com/Miniiceage
TWITTER https://twitter.com/adapt2030