
 Super-freeze that swept over the Midwest and great lakes regions in January to be outdone by the SuperFreeze 2.0 another Polar Vortex, which made three in total for 2019 breaking every temperature record ever set in some of the coldest cities in the northern US states. How many times will 30-50F below normal temperatures dip to Texas and Mexico before someone in the corporatae media points out the wordl is supposed to be getting warmer according to the IPCC, why is the coldest ever?
New York’s Super Freeze & Polar Vortex Aftermath Midwest
I would like to inform you that the video series ADAPT 2030, YouTube is being backed up at ADAPT 2030 on Brighteon. I have a little more than 300 videos there at the moment so head over there to watch and subscribe to the freedom platform.

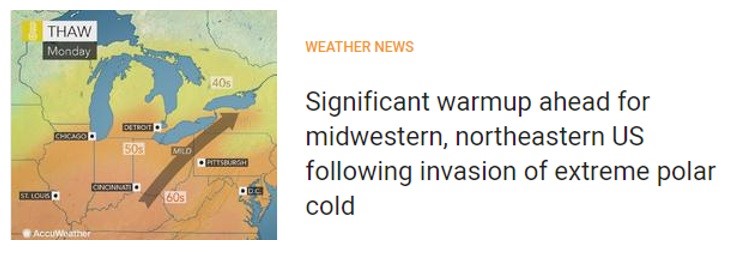
Severe Weather Alerts! By now, everyone must have expected this, as the extreme super freeze that swept through the Midwest and the Great Lakes, moved eastward.
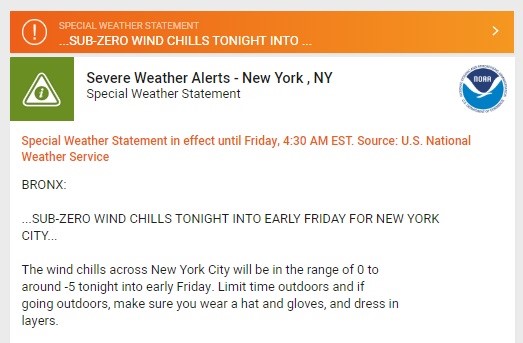
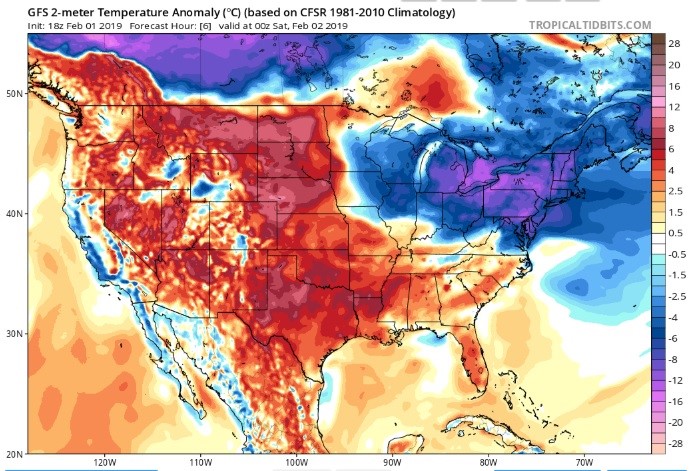
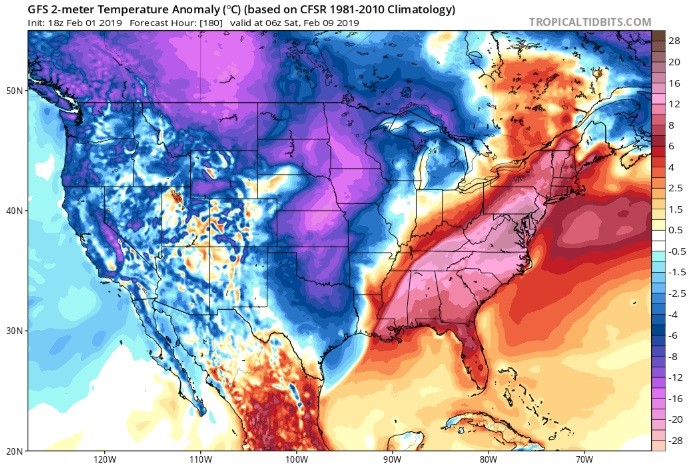
Also, some of the all-time record cold temperatures we saw being broken through the mid-west, I don't think that's going to happen over the New England states, but they’re going to have temperatures that are -0F. As shown on the Temperature Anomaly Map, the super freeze front is going to pass offshore out into the Atlantic, and will be followed by extreme warmth.
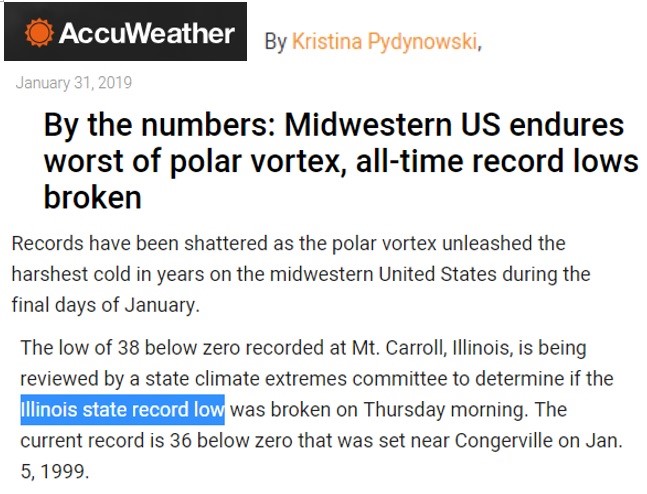
Looking at the numbers recorded, Midwest states experienced polar vortex, breaking all-time record lows across the mid-west. The new state record in Illinois is now 38 degrees Fahrenheit below zero, and those are standing on the ground temperatures, not wind chills.
The media of course will quickly focus on the heat, to try to make you forget about what just happened. To point it out, this is such an outlier. This shouldn't be happening during what is considered a “Global Warming”, but it is. But then, corporate media is going to focus on the heat that's coming over next week, instead of reporting the all-time record temperatures occurring now. Focusing on the future so you forget the present.
Notice, behind that heat, there's another polar vortex event coming around the 9th and 10th of February, but it's going to dip further south this time, and then behind that there's still another cold front attached to it. So we are going to get this first frontal boundary, followed by a second polar front that is connected to this. You can expect more record low temperatures and snow records to be broken again in the second week of February. This time it’s going to push into Texas, Kansas, Oklahoma, Louisiana further south.
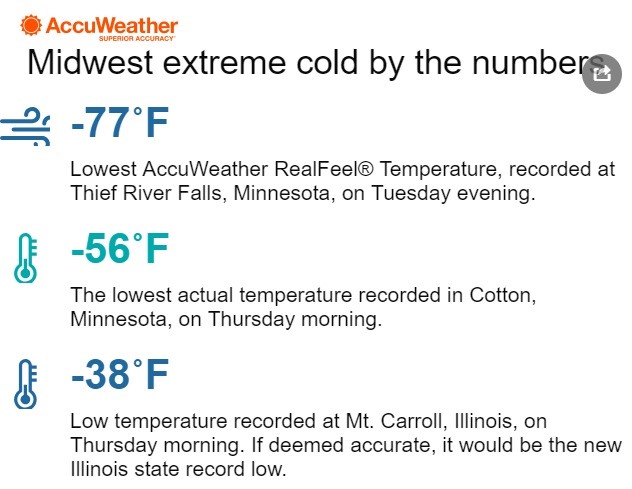
Meanwhile, let’s take a look at some of the numbers during the all-time record super freeze in the Midwest. Before that, I would like to express my appreciation to AccuWeather for putting all this information together. I was really impressed that instead of trying to hide these numbers, they actually put them together, making it so discernable and so easy to understand the epic proportions of the event and wide spread area it covered. Moreover, they left all the comments, which I found fascinating.
Here is the article, Midwest extreme cold by the number. First stop is the RealFeel weather in Thief River Falls. (RealFeel means wind chill is included) that city had 77 degrees Fahrenheit below zero wind chills that were recorded. Then Cotton, Minnesota had on the ground standing temperatures with no windchill of 56 degrees Fahrenheit below zero. Finally, Mount Caroll, Illinois recorded the lowest temperature, ever, of 38 degrees Fahrenheit below zero. This would be the new Illinois state record for all-time cold.
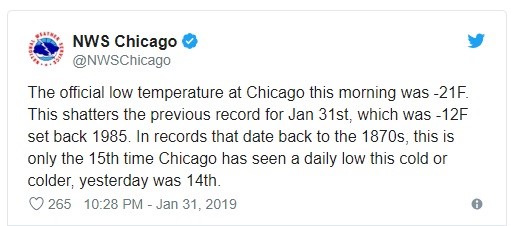
And in Chicago, finally the missing numbers have been tallied, as there was an hour of missing data. Can you imagine that? This would’ve give an all-time record cold in Chicago. This hour of missing data would have made this record a “record”.
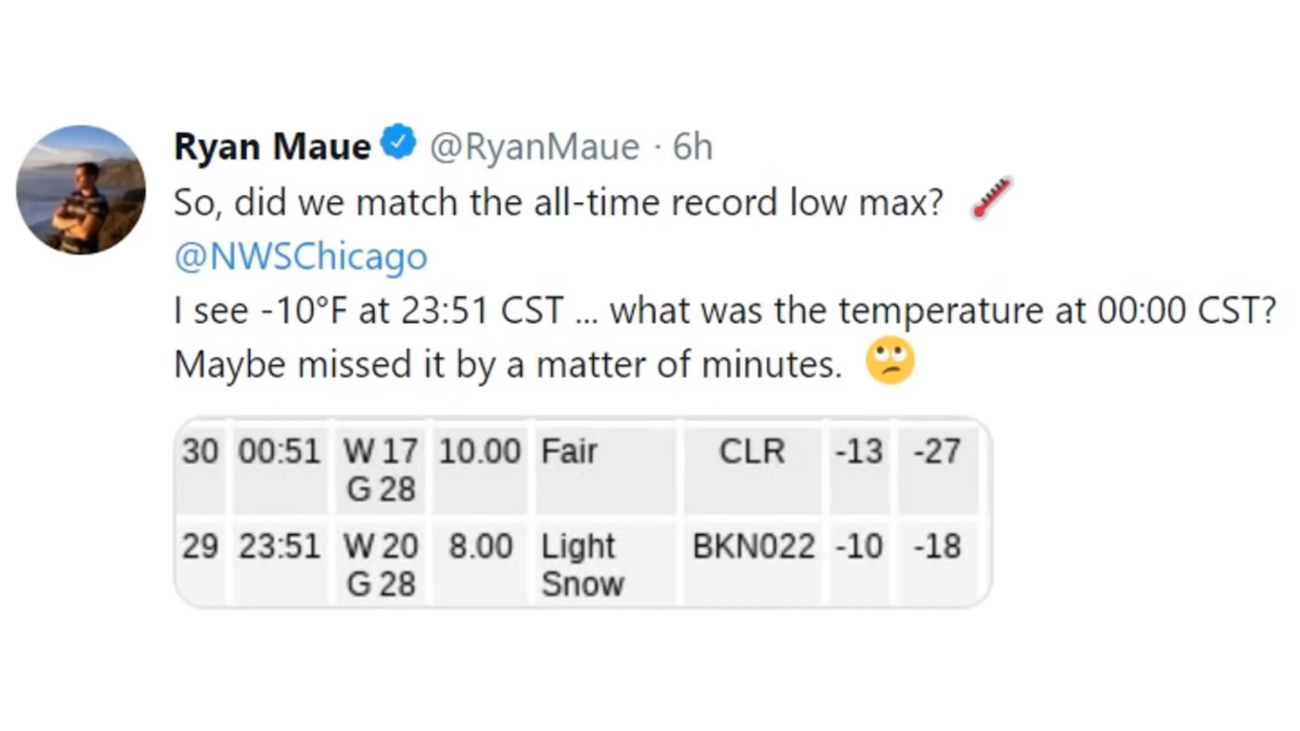
Suddenly, the missing data appeared. The old record was at 21 degrees Fahrenheit below zero, while the new record is at 23 degrees Fahrenheit below zero. This is now Chicago’s new record cold.
Jumpping back to 1996, you can see Minneapolis with this type of cold, but this seems to be more of a cycle, than a linear thing as they’ve been saying, that people are putting CO2 in the air. This is also the first time ever, that nine states experienced 14 degrees Fahrenheit below zero at the same time. This set a new all-time record as well.

At first, the official low temperature in Chicago was 21 degrees Fahrenheit below zero, but with the hour of missing data there was a push demanding National Weather Service (NOAA) release the missing data. After magically finding the missing data, temperatures showed 23 degrees Fahrenheit below zero. This then became the new all-time coldest temperature ever recorded.
Temperatures recorded in this city dates back to the 1870s, and again, this is a climate cycle that we're encountering. Now our world is starting to break everything from 200-year to 300-year then finally to 400-year records, as we get into the depths of the Grand Solar Minimum. The years around 2023 would be the coldest of the first wave of two waves that are coming taking us out to 2035.
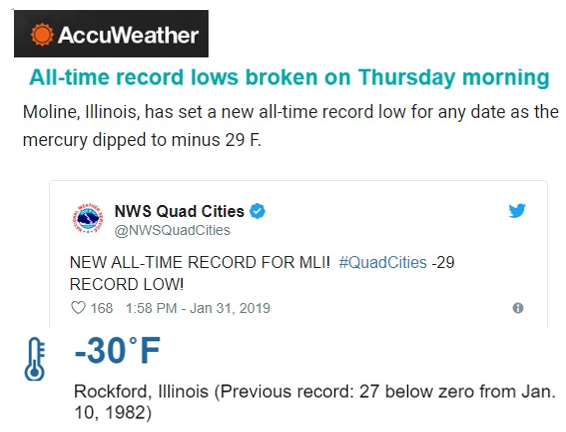
More all-time record lows: 33 degrees Fahrenheit below zero in Moline and 30 degrees Fahrenheit below zero in Cedar Rapids, Iowa and Rockford, Illinois.
If you look at some of the older records, you see how much these were broken by. There is as much as 10 degrees Fahrenheit difference from the old record.
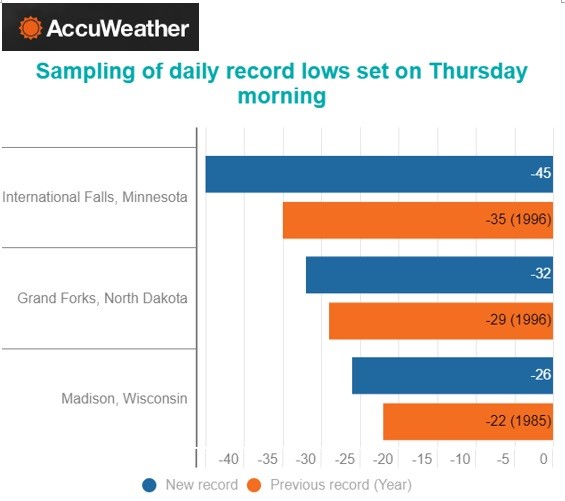
The data below is the sampling of daily record lows. This is where you go if you want to look at the temperature differences. International Falls, Minnesota had an old record cold temperature in 1996 of 35 degrees Fahrenheit below zero, while the new record cold temperature was 45 degrees Fahrenheit below zero. There was 10 degree difference on the cooling, that's gargantuan. Even a lot of the records are being broken by 1 or 2 degrees Celsius in Australia from the heat, like 1 degree warmer than the previous record, but this one is 10 degrees cooler. Grand Forks, North Dakota and Madison, Wisconsin had some of the newer records as well.
So let me point out that 1980’s were a cold decade and I've noticed that the media keeps pushing the narrative that the 80s were much colder than this decade that we’re in. This is one of the events that's “pushed back Global Warming by two days” with all of the new record cold. Corporate media will not discuss the Grand Solar Minimum.
Indeed, the 1980’s was a cooler decade, but I love how they shifted the narrative, instead of really focusing on the fact that this current event smashed all these all-time record colds in hundreds locations. All records being broken, literally, in a day. This means, that this day is colder, not the decade. Who cares about the average over the decade, this is GSM amplification event that nobody wants to talk about.
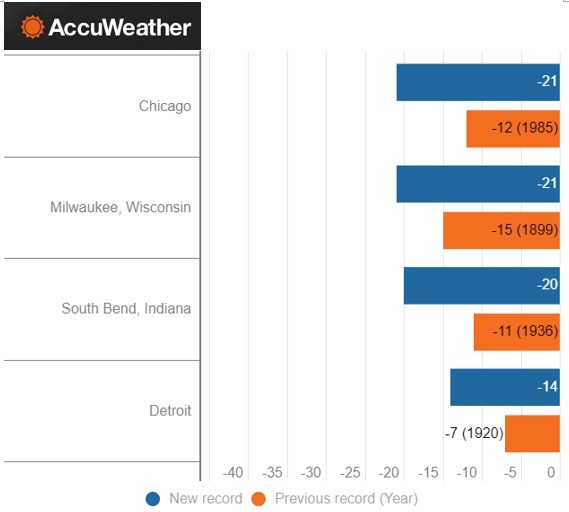
Take a look at the difference in Chicago, from 21 to 12 degrees Fahrenheit, below zero. Then we get back to these longer records in 1899 Milwaukee, Wisconsin with temperature record of 21 from 15 degrees Fahrenheit, below zero. Also, South Bend, Indiana had old record of 11 degrees Fahrenheit below zero in 1936 and a new record of 20 degrees Fahrenheit below zero now. That's 8 degrees difference. Then Detroit, of all places, 7 degrees Fahrenheit below zero in 1920 and 14 degrees Fahrenheit below zero now.
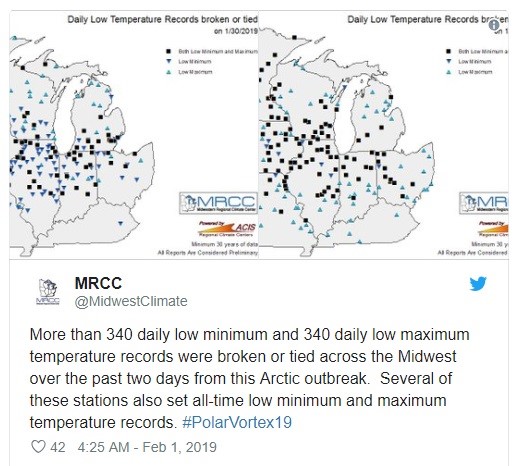
More importantly, this map shows the temperature stations that have broken the daily low records or the maximum high records for the day. It is at least 340 locations in what are considered city or suburbs. These are not out in the rural areas. So they're trying to aggregate data in places where they don’t have official temperature stations with persons who actually have thermometers and are taking readings in rural areas. The numbers are still coming in because some areas are in the farmlands and areas that are further rural.
National Weather Service in Duluth put out the 8:00 P.M. temperatures as shown, with incredible lows. This was not wind chill; these were standing on the ground temperatures. The lighter colored teal is any temperature that's either in the 20s or 10s degrees Fahrenheit below zero.

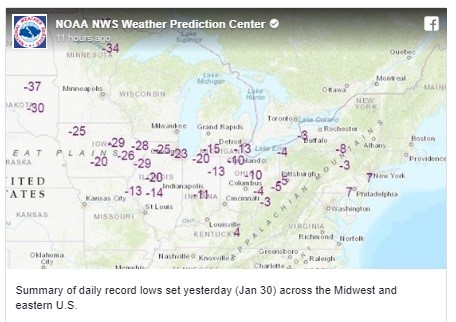
And as the storm continues to march eastward, these were all the new record lows that were set through Ohio and Pennsylvania, moving over to New York.
PDF of this Article New York’s Super Freeze & Polar Vortex Aftermath Midwest
FULL VIDEO New York’s Super Freeze & Polar Vortex Aftermath Midwest
"Help support the adapt 2030 channel on brighteon so we can keep grand solar minimum information free to access."
Volcanism in the Mini Ice Age, Which Eruption will Drop Earth's Temperate Next (385)
https://www.brighteon.com/6010048504001
***Mini Ice Age Conversations Podcast***
iTunes: https://itunes.apple.com/us/podcast/adapt2030
Soundcloud: https://soundcloud.com/adapt-2030
Libsyn: http://adapt2030.libsyn.com/
***Support ADAPT 2030 by Visiting Our Sponsors***
ADAPT 2030 & My Patriot Supply
Taking the Fear Out of Difficult Situations
2-Week Food Supply with 92 servings
True Leaf Market Organic & Heirloom Seeds
ADAPT 2030 True Leaf Market Link
ADAPT 2030 Amazon Grand Solar Minimum Book Store
https://www.amazon.com/shop/adapt2030
*** Today’s Story Links ***
By the numbers: Midwestern US endures worst of polar vortex, all-time record lows broken https://www.accuweather.com/en/weather-news/polar-vortex-by-the-numbers-6-states-in-us-record-temperatures-lower-than-south-pole/70007296
Polar vortex’s bitter cold could cost US economy $5 billion, though the worst may be over https://www.accuweather.com/en/weather-news/polar-vortexs-bitter-cold-could-cost-us-economy-5-billion-though-the-worst-may-be-over/70007309
77 below zero? Polar vortex yields deadly cold as thousands endure power cuts, travel issues mount in Midwest https://www.accuweather.com/en/weather-news/75-below-zero-polar-vortex-yields-deadly-cold-as-thousands-endure-power-cuts-travel-issues-mount-in-midwest/70007291
NATIONAL WEATHER SERVICE maps of shattered temperature records https://www.facebook.com/NWSWPC/photos/a.163357820397809/2171143226285915/?type=3&theater
Temperature anomaly map New York & USA https://www.tropicaltidbits.com/analysis/models/?model=gfs®ion=us&pkg=T2ma&runtime=2019020118&fh=6
*** ADAPT 2030 Social Media Links ***
PATREON www.patreon.com/adapt2030
YOUTUBE ADAPT 2030 Mini Ice Age 2015–2035 Series on YouTube
BITCHUTE https://www.bitchute.com/hashtag/adapt2030/
BRIGHTEON https://www.brighteon.com/channel/adapt2030
STEEM https://steemit.com/@adapt2030
MINDS https://www.minds.com/ADAPT2030
MEDIUM https://medium.com/@globalcooling
FB https://www.facebook.com/Miniiceage
TWITTER https://twitter.com/adapt2030