
 Extremes of colliding air masses record heat on one side and record cold on the other in N. America and Europe. This indicates that the weakening magnetosphere is allowing the jet streams to bend, break and collapse into new positions across the planet.
Massive ice growth on Great Lakes, Antarctica cools as unsettled science as now new discoveries about the Atlantic currents effecting our climate.
Day After Tomorrow Scenes, Antarctica Cools & Jet Streams Bent
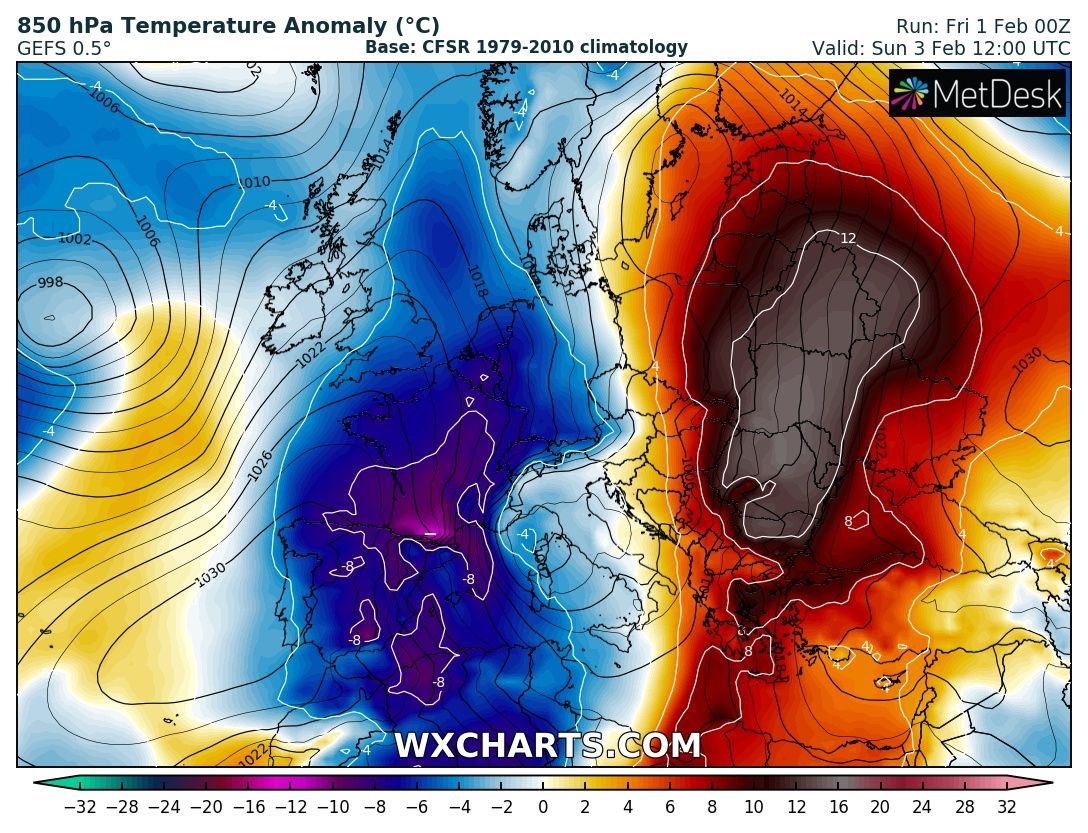
While the super freeze was going on in the United States, Europe experienced the exact same thing. Record heat on one side of the jet stream smashing against record cold on the other side. The jet streams are out of place, with wrong temperatures, wrong locations and wrong seasons interweaving in Earth’s atmosphere stabilization effort during a once in a 400-year solar output decline.
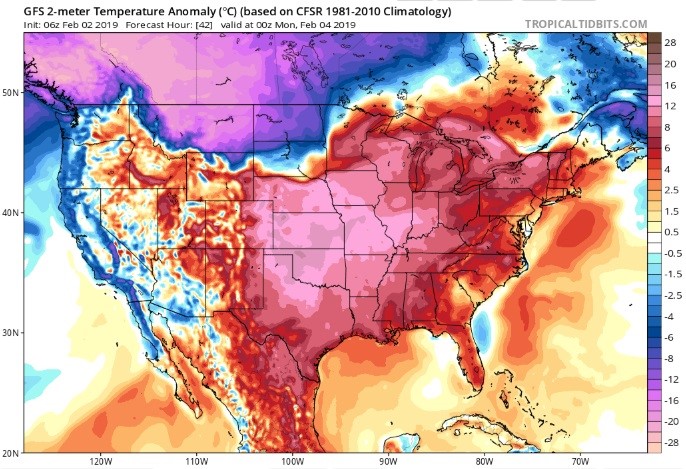
Following that in the United States there was abnormal heat, followed by a super freeze and still another super freeze 2.0, polar vortex in February which sweep all the way to Texas and Louisiana.
This is exactly what you'd be looking at as a result of jet streams that are out of their normal flow patterns. With Earth’s magnetosphere weakening as we get deeper into the Grand Solar Minimum. If it's like this in 2019, I am unnerved thinkng of what's going to happen in 2023.
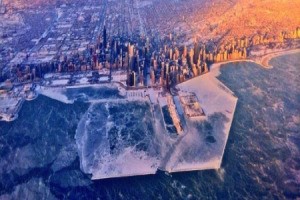
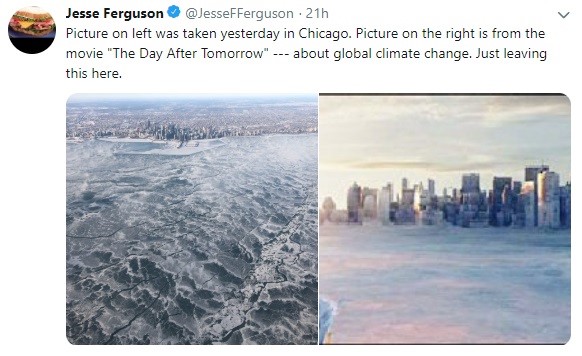
Question, “The Day After Tomorrow.” which picture is on the left, and which picture is on the right? (Left picture is Chicago) during the recent super freeze, polar vortex 1.0. I wonder if this was a prophetic programming from Hollywood. (Day After Tomorrow movie scene on the right) makes you think about it for a second there, doesn't it?
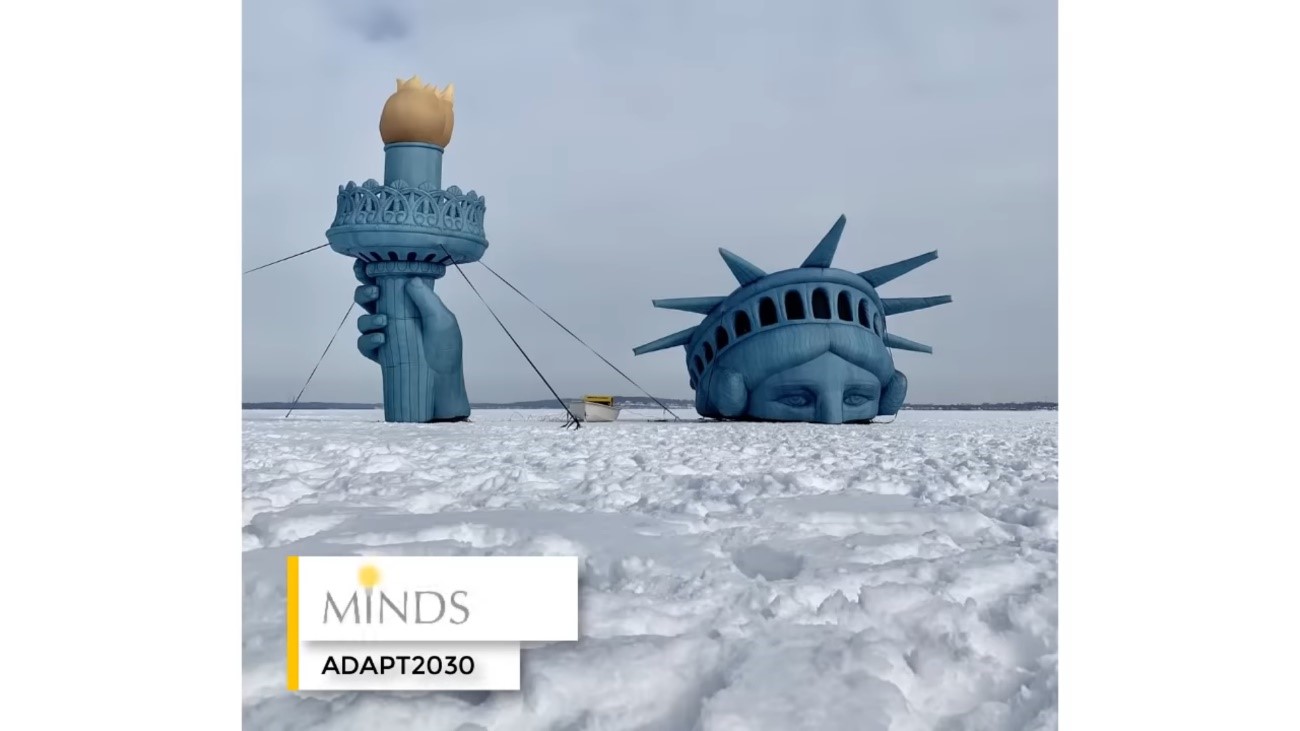
Artist over the ice, you can’t do much when you're locked down in the coldest temperatures ever recorded across the U.S Great Lakes Region
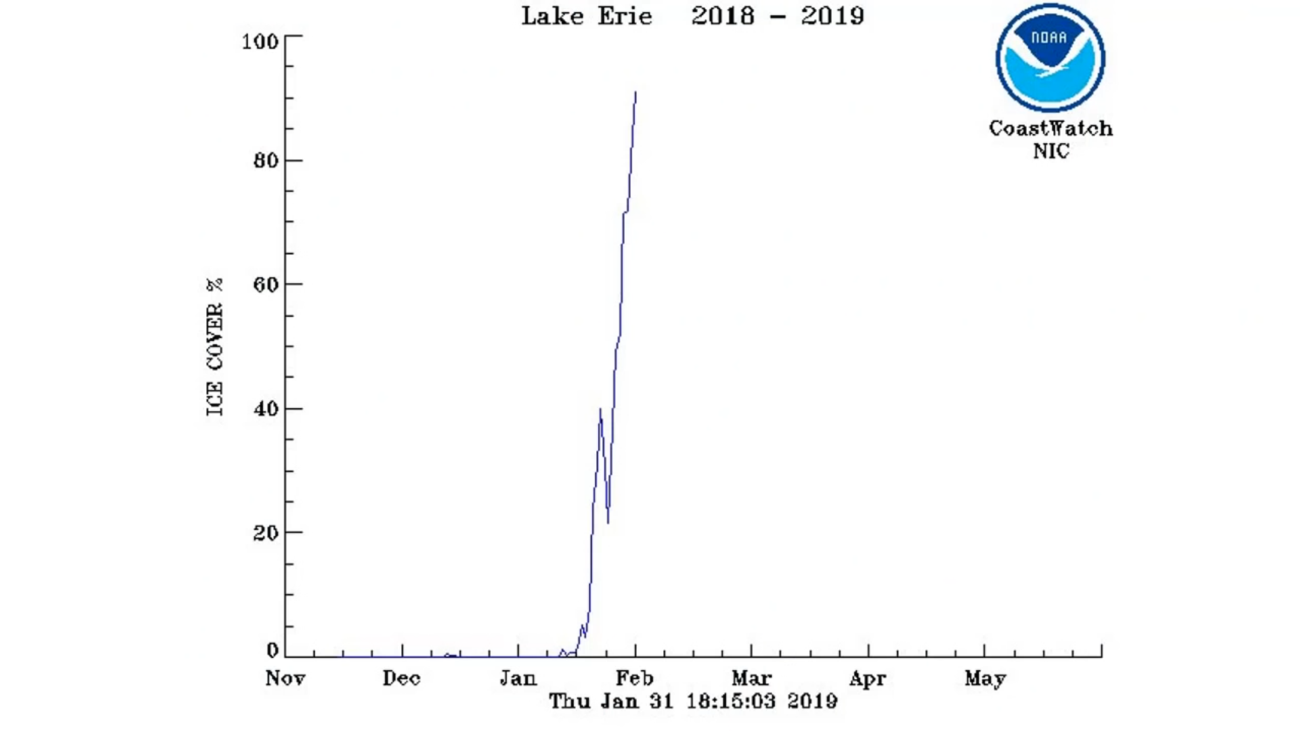
As the polar vortex swept across the Great Lakes, you would expect massive ice gains, but not this massive! Vertical ice growth that went from 3% to 90% ice coverage, in just two weeks. This amount of ice coverage is astounding!
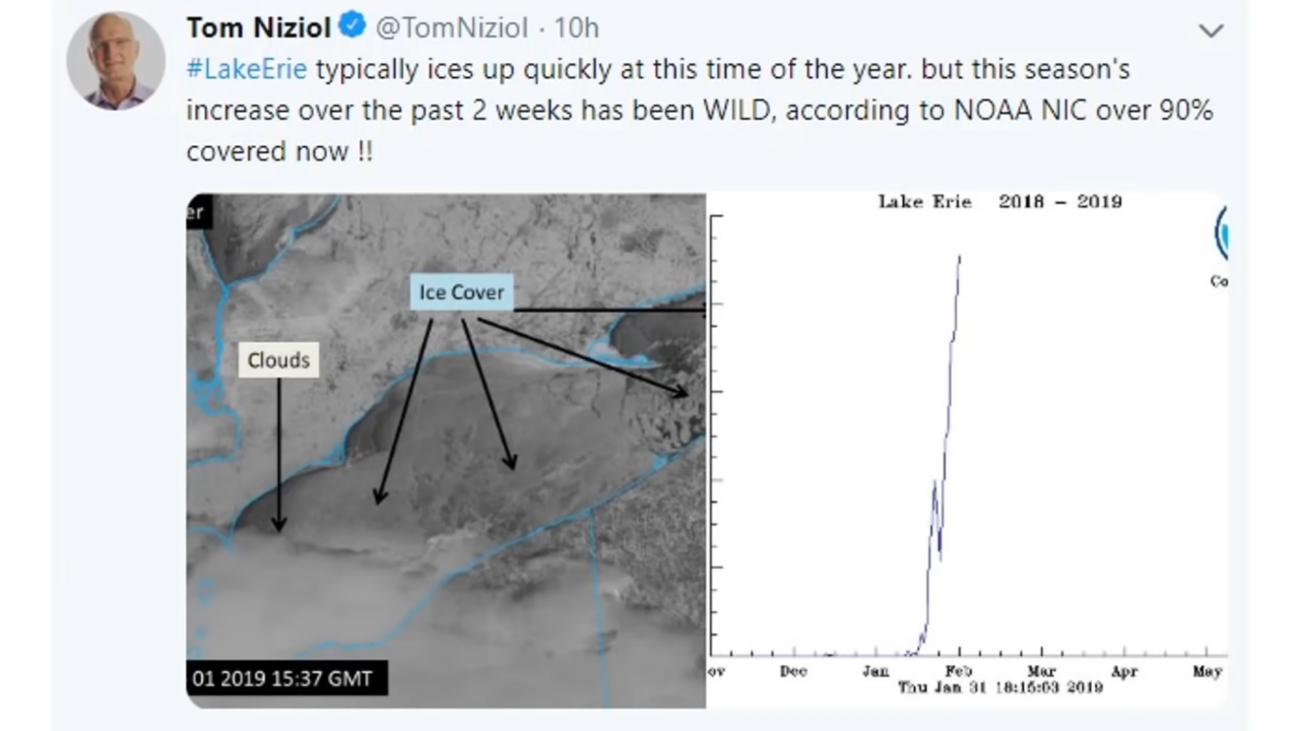
This straight up trajectory doesn’t normally happen, it's usually more of a curve up. Lake Erie is pretty much at 100% coverage now.
This is a satellite image of ice cover and clouds off the GOES-Visible.
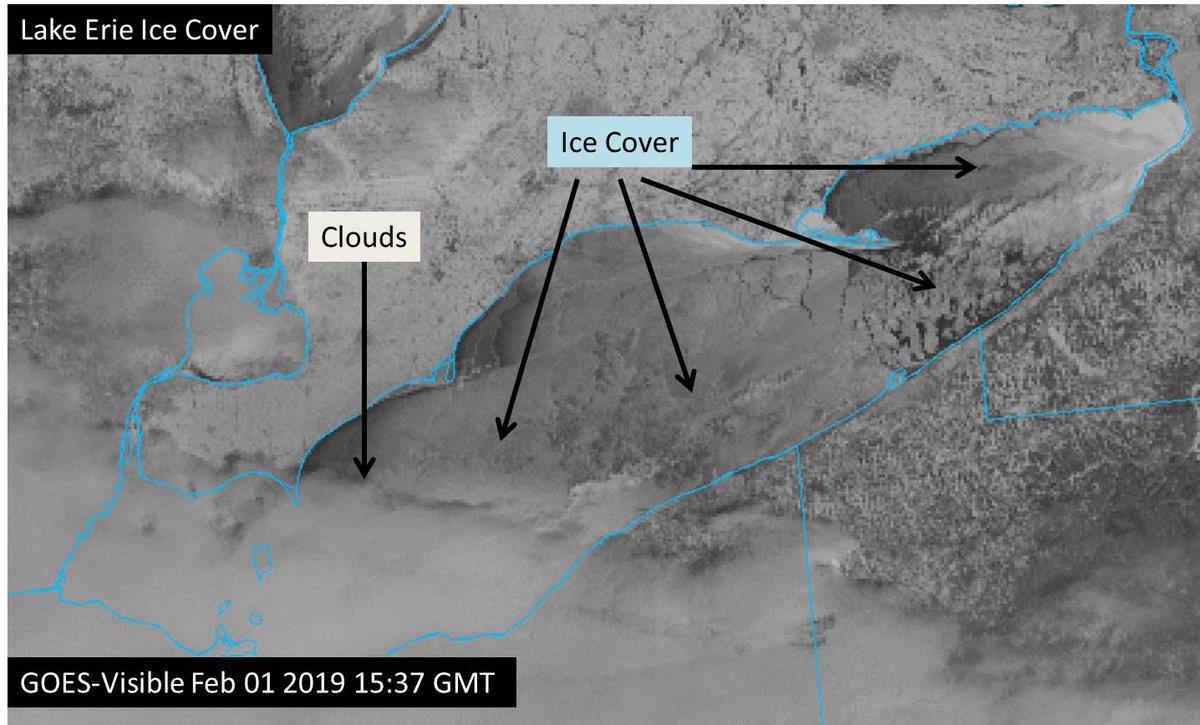
(BELOW) Looking at Great Lakes surface data from NOAA, that blue on the map is an open water with the percentages of how much of it has frozen or not. Anything that's gray is 100% coverage.
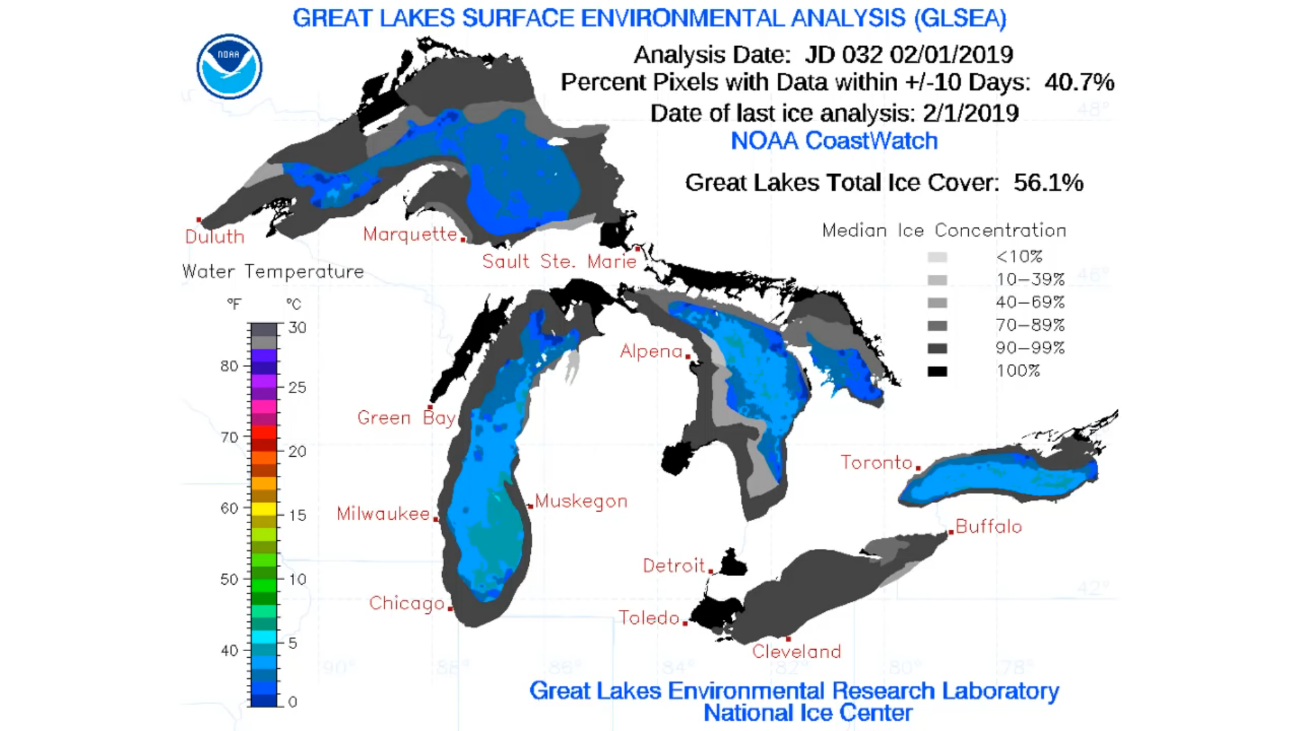
Ice growth progression on this grayscale map and is a week old compared to the previous colored schematics. These changes are rapid, and we will have to see if this sets the fastest pace for all-time record ice growth on the Great Lakes.
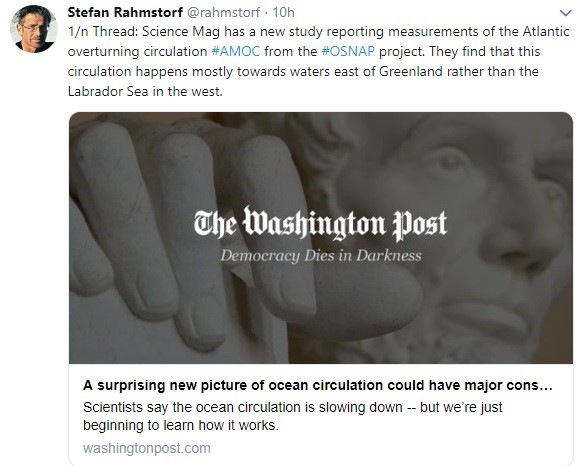
Over to the Washington Post with: A surprising new picture of ocean circulation currents. New research just published. I thought the IPCC said that the science was settled. I thought scientists knew every mechanism and every inkling of the way the climate moves as guaranteed by 93% of the scientists! It is no longer 97% of those who agree with Global Warming and CO2 as the main cause of the changes on our planet according to corporate media, has dropped to 90%. Anyway, I guess this “new research” scapegoat means, that science is not really settled.
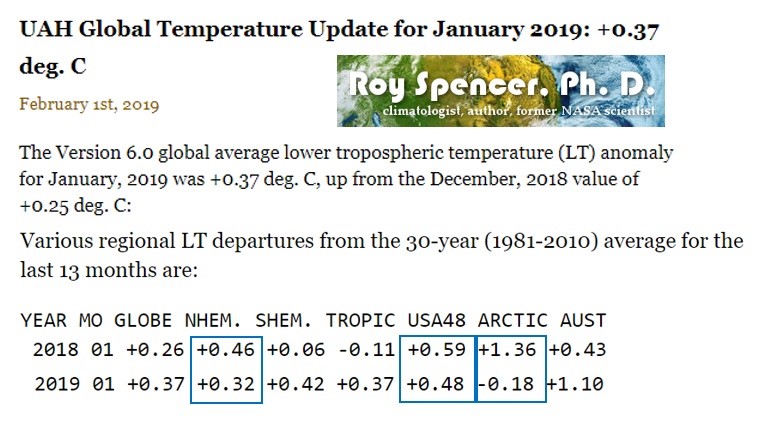
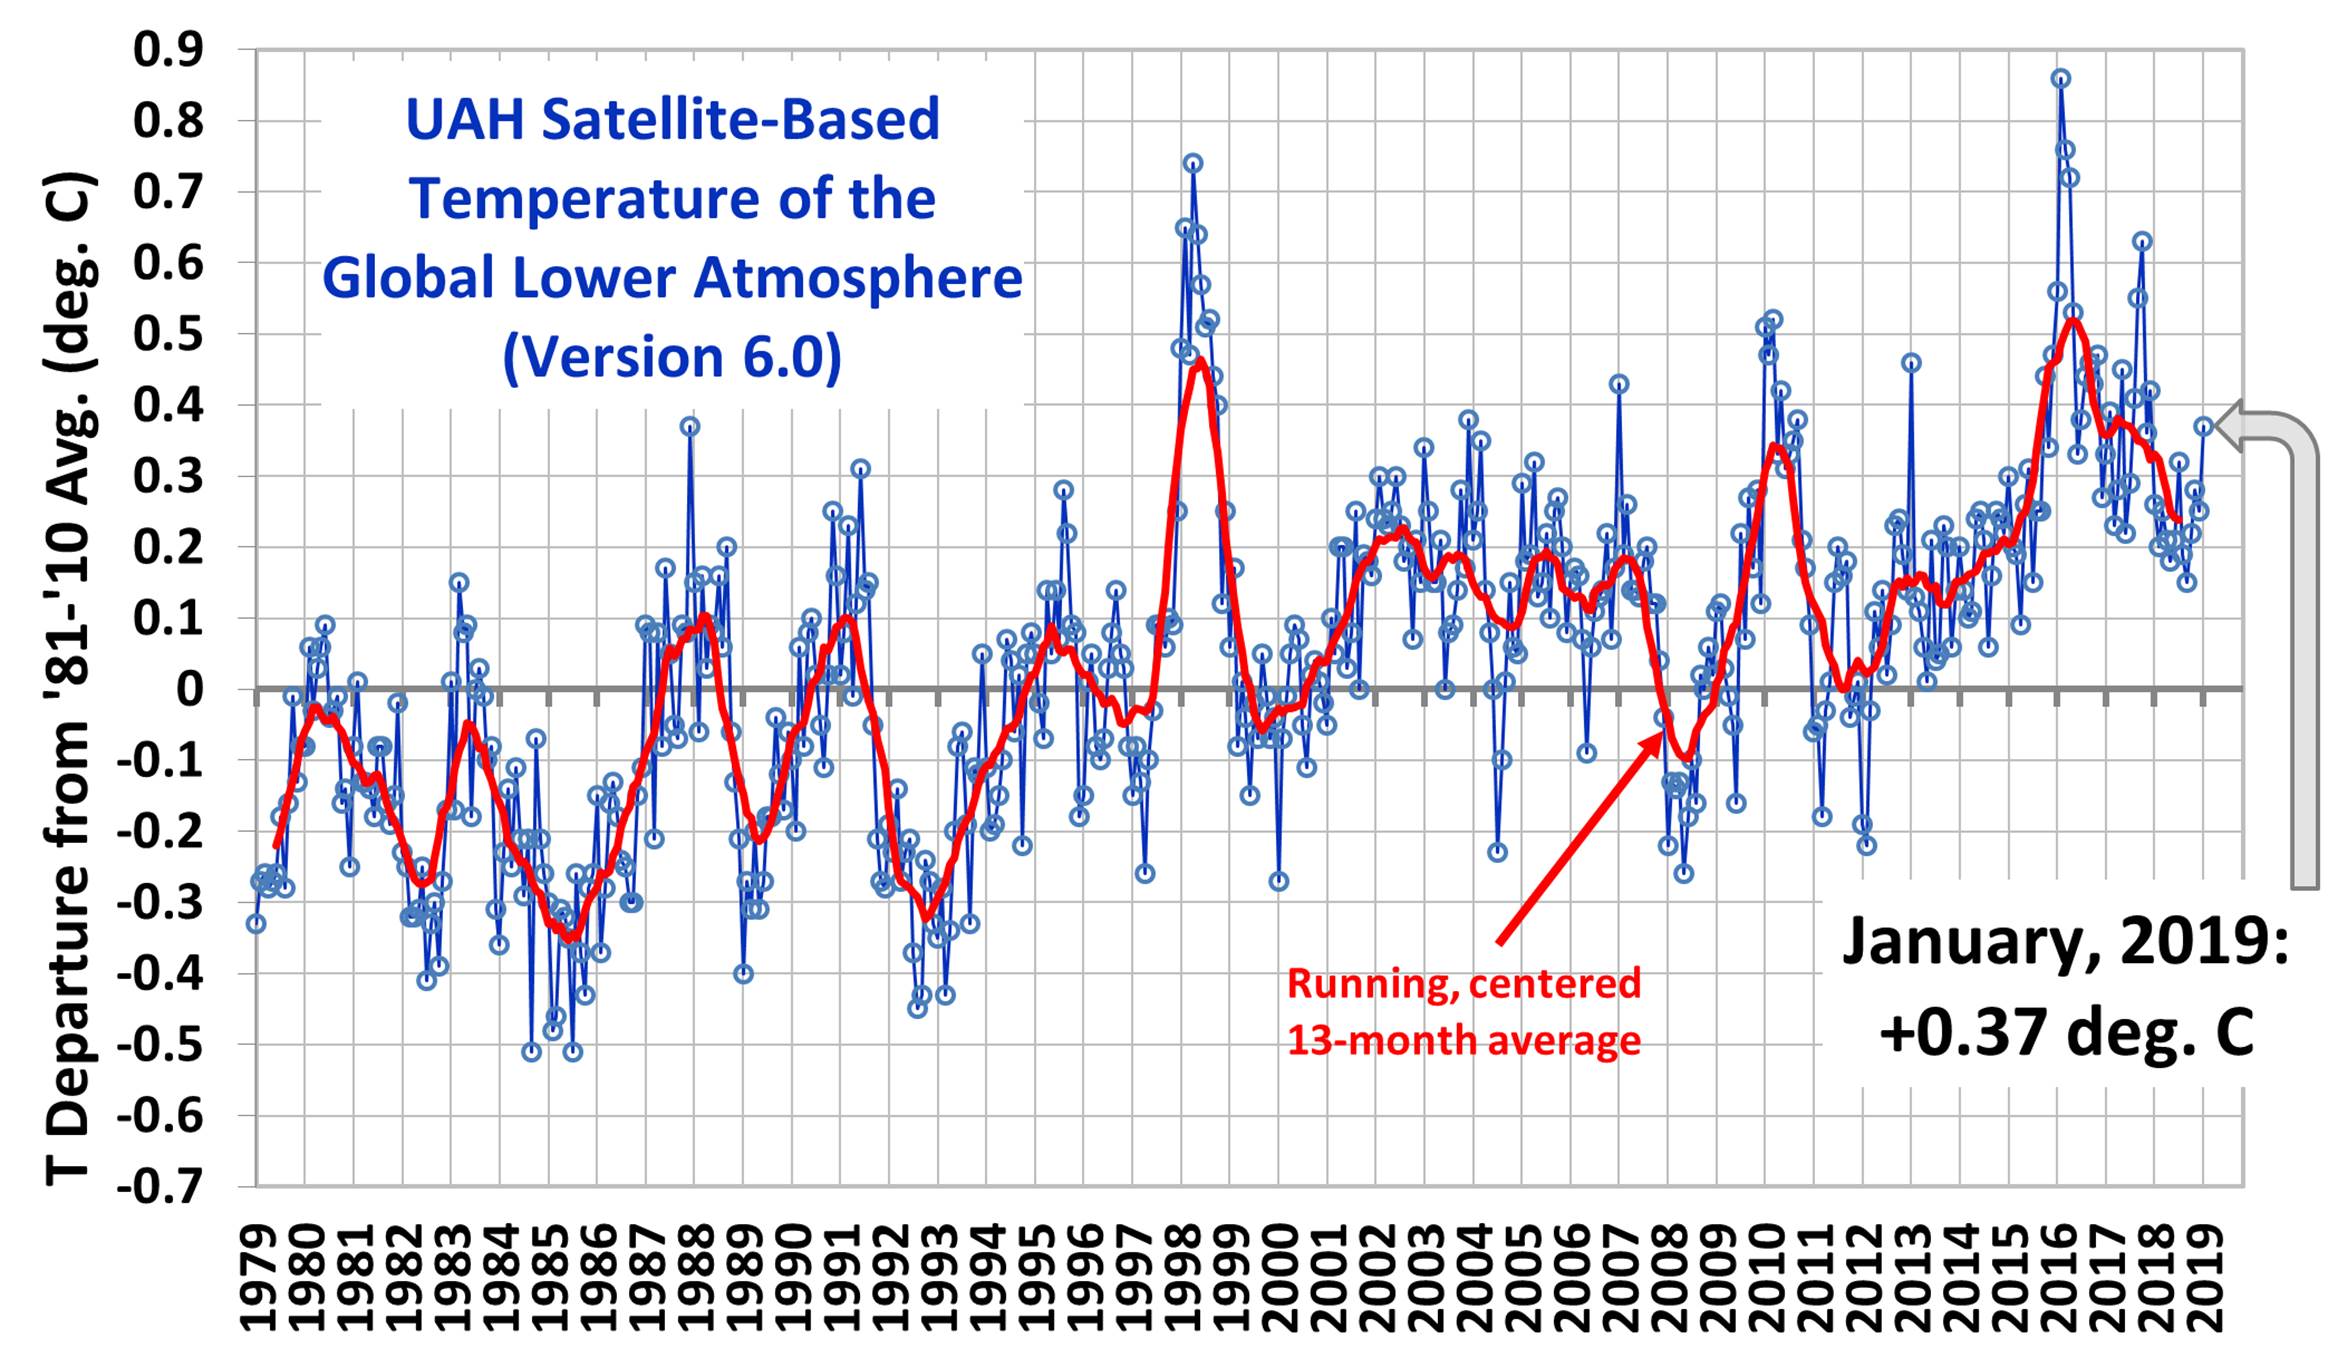
Over to Dr. Roy Spencer’s site and January global temperatures, up a little from December 2018. It’s 0.37C above the 30 year baseline average.
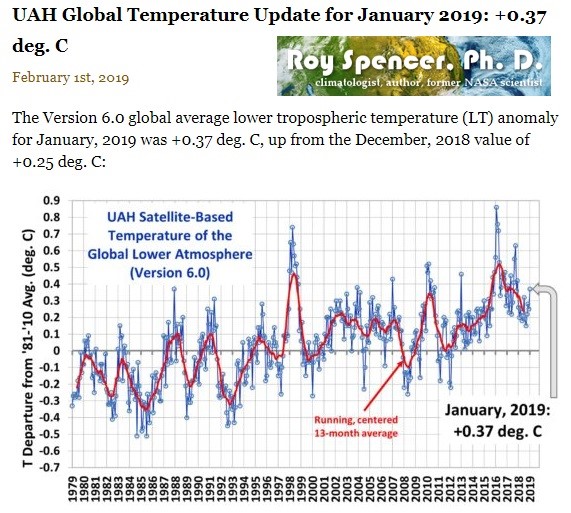
(BELOW) What I like about Dr. Spencer’s site is, temperature data is broken down by regions on the planet so you can get a good indication of where it’s cooling and warming. There is a decrease everywhere in a blue box, when you compare January, 2018 to January, 2019.
So where are decreases happening? Mostly in the Northern Hemisphere. Keep that in mind when you look where most of the grains on our planet grown in terms of food belts and crop production? The Southern Hemisphere is warming while the Northern Hemisphere is cooling more, the problem is we produce much more food in the Northern Hemisphere.
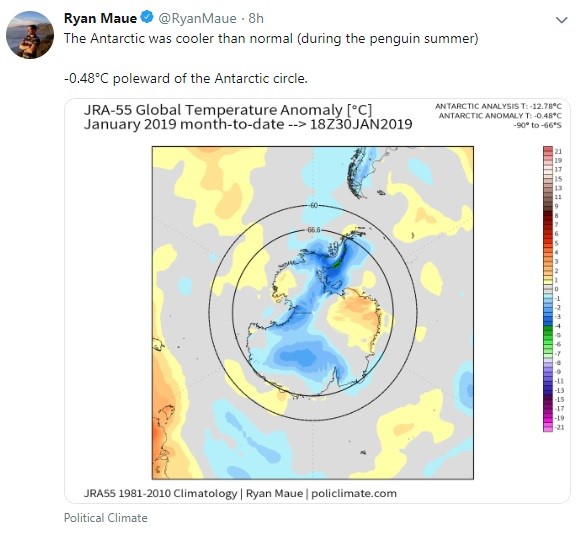
And as a caveat to the warming Southern Hemisphere, Ryan Maue put out the Antarctic temperatures, down -0.50C. It was cooler than normal during the Penguin summer, so I'm wondering if this was an indication, that as we go through the next 2 seasons the Southern Hemisphere will start to cool as well. The southern feedback cooling loop may start with Antarctica because the Grand Solar Minimum is in full amplification mode at the moment.
Thanks for reading, I hope you got something out of the article. If you like more information like this I produce the tri-weekly Mini Ice Age Conversations podcast, 30 minutes of in depth analysis on the GSM you can take on the go.
PDF of this Article Day After Tomorrow Scenes, Antarctica Cools & Jet Streams Bent
FULL VIDEO Day After Tomorrow Scenes, Antarctica Cools & Jet Streams Bent
"Help support the adapt 2030 channel on brighteon so we can keep grand solar minimum information free to access."
We are Repeating 14th Century Climate During the Wolff Grand Solar Minimum Minimum
https://www.brighteon.com/6010048421001
***Mini Ice Age Conversations Podcast***
iTunes: https://itunes.apple.com/us/podcast/adapt2030
Soundcloud: https://soundcloud.com/adapt-2030
Libsyn: http://adapt2030.libsyn.com/
***Support ADAPT 2030 by Visiting Our Sponsors***
ADAPT 2030 & My Patriot Supply
Taking the Fear Out of Difficult Situations
2-Week Food Supply with 92 servings
True Leaf Market Organic & Heirloom Seeds
ADAPT 2030 True Leaf Market Link
ADAPT 2030 Amazon Grand Solar Minimum Book Store
https://www.amazon.com/shop/adapt2030
*** Today’s Story Links ***
SmashOmaSh Channel Solar Wind Forecast and analysis
https://www.youtube.com/watch?v=wUmCnmi2CG4
Lake Erie Ice cover https://pbs.twimg.com/media/DyVMhpPX4AEWzDn.jpg https://pbs.twimg.com/media/DyVNFTtW0AA7RdN.jpg
Great Lakes Ice Coverage
https://www.glerl.noaa.gov//res/glcfs/glcfs.php?lake=l&ext=ice&type=N&hr=00
https://coastwatch.glerl.noaa.gov/glsea/cur/glsea_cur.png
DMI Arctic Ice http://ocean.dmi.dk/arctic/icethickness/images/FullSize_CICE_combine_thick_SM_DK_20190130.png
Significant warmth will develop across the Balkan peninsula and SE Europe through the next 4 days, Feb 1-5th
http://www.severe-weather.eu/wp-content/gallery/weather-maps/850temp_anom_20190201_00_060.jpg
http://www.severe-weather.eu/wp-content/gallery/weather-maps/2mtemp_anom_20190201_00_084.jpg
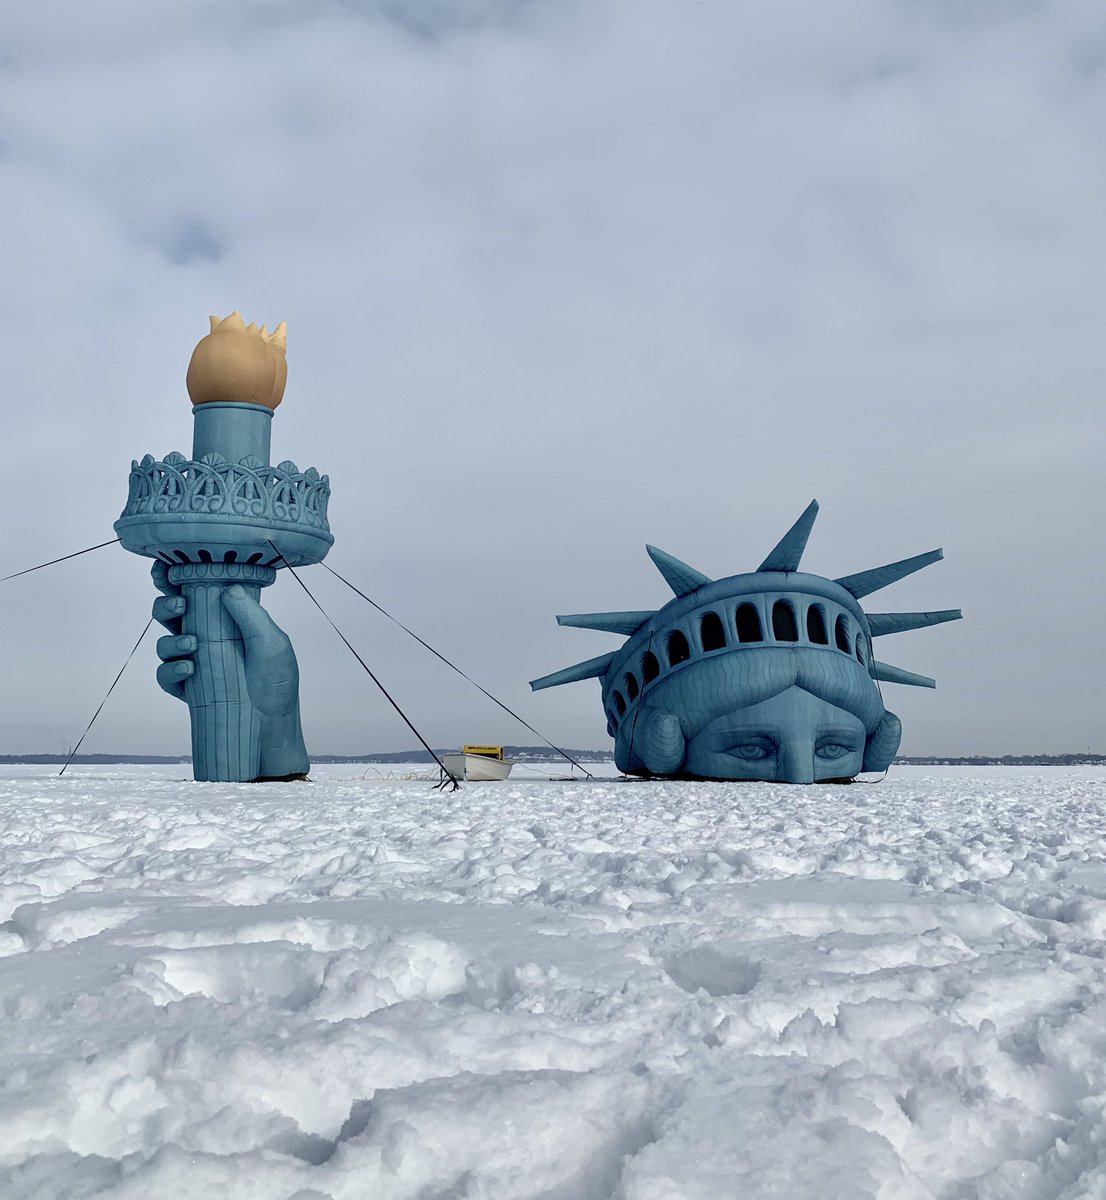
Statue of Liberty below ice https://pbs.twimg.com/media/DyViUoPWsAIrEPa.jpg
The Version 6.0 global average lower tropospheric temperature (LT) anomaly for January, 2019 was +0.37 deg. C, up from the December, 2018 value of +0.25 deg. C http://www.drroyspencer.com/
http://www.drroyspencer.com/2019/02/uah-global-temperature-update-for-january-2019-0-37-deg-c/
http://www.drroyspencer.com/wp-content/uploads/UAH_LT_1979_thru_January_2019_v6.jpg
Tropical Tidbits temperature anomaly https://www.tropicaltidbits.com/analysis/models/?model=gfs®ion=us&pkg=T2ma&runtime=2019020206&fh=6
*** ADAPT 2030 Social Media Links ***
PATREON www.patreon.com/adapt2030
YOUTUBE ADAPT 2030 Mini Ice Age 2015–2035 Series on YouTube
BITCHUTE https://www.bitchute.com/hashtag/adapt2030/
BRIGHTEON https://www.brighteon.com/channel/adapt2030
STEEM https://steemit.com/@adapt2030
MINDS https://www.minds.com/ADAPT2030
MEDIUM https://medium.com/@globalcooling
FB https://www.facebook.com/Miniiceage
TWITTER https://twitter.com/adapt2030